New Home Builder Warranty Report:
The new home builders saw a bit of respite from rising warranty costs in 2024. Total warranty accruals in the industry increased by less than 1%, total claims paid decreased by -2%, and reserve end-balances increased by just 4%, showing some stability after years of skyrocketing construction, repair, and warranty costs.
According to data published by the U.S. Census Bureau in January 2025, housing completions increased by 12% from 2023 to 2024. However, total housing starts were down by 4% from 2023 to 2024.
On the warranty side, year-over-year, average accruals per home sold decreased in the second, third, and fourth quarters of 2024, compared to the respective quarters in 2023. Total warranty claims paid by the new home builders decreased from 2023 to 2024, but total warranty accruals increased slightly, and reserve end-balances increased as well.
About half of the U.S.-based new home builders publish their warranty expenses in their annual reports and quarterly financial statements. These companies also publish data on the number of new homes sold, and the amount of homebuilding revenue they made (excluding land sales and mortgage-lending income, if any).
Thus, just for a set of 22 homebuilders, we are able to calculate the amount of warranty accruals made per new home sold, similar to accruals per vehicle sold that we calculate for the global auto manufacturers.
Our data set for this newsletter includes 22 homebuilders for which we calculated accruals per new home sold: AV Homes Inc., Beazer Homes USA Inc., CalAtlantic Group Inc., Century Communities Inc., D.R. Horton Inc., Green Brick Partners, Hovnanian Enterprises Inc., KB Home, LGI Homes Inc., Landsea Homes, Lennar Corp., M.D.C. Holdings Inc., M/I Homes Inc., Meritage Homes Corp., NVR Inc., New Home Co. Inc., PulteGroup Inc., Ryland Group Inc., Shea Homes LP, Taylor Morrison Home Corp., Toll Brothers Inc., and William Lyon Homes.
We also gathered data from Dream Finders Homes Inc., but since the company only reports on an annual basis, we did not calculate accruals per home sold, since we track that metric on a quarterly basis for the other 22 homebuilders.
In addition, we gathered data from a few more homebuilders that make mobile homes, modular homes, manufactured homes, and tiny houses: Champion Homes Inc., Cavco Industries Inc., Legacy Housing Corp., and Nobility Homes Inc. The warranty claims paid, accruals made, and reserves held by these five additional companies are factored into the totals presented in Figures 1, 2, and 3, but are not included in the accrual rate per home sold charts.
Note that Champion Homes Inc. was known as Skyline Champion Corp. until August 2024. The company was named Skyline Champion in 2018, when Champion Enterprises Holdings LLC combined with Skyline Corp.
There's a fine line between mobile homes, such as those manufactured by Champion and Cavco, and recreational vehicles, such as those manufactured by Winnebago and Thor Industries. Essentially, if it's designed to be stationary, it's a mobile home, and the manufacturer is categorized as a new home builder. If it's designed to be driven around, it's an RV, and the manufacturer is placed in the truck & bus category.
For each of the 27 new home builders, we perused their annual reports and quarterly financial statements, and gathered three key warranty metrics: the amount of claims paid, the amount of accruals made, and the end-balance of the warranty reserve fund. In addition, for 22 of the homebuilders, we also gathered data on the amount of homebuilding revenue they reported, and the number of homes sold. Using these data, we calculated three additional warranty ratios: claims as a percentage of sales revenue (the claims rate), accruals as a percentage of revenue (the accrual rate), and the dollar amount of warranty accruals set aside per home sold (total accruals / number of homes closed).
Warranty Claims Totals
Figure 1 shows the total warranty claims paid by the 27 homebuilders over 10 years, from 2015 to 2024. These data also include homebuilders that were not in business, or no longer reporting, in 2024, but reported at some time in the 10-year period.
Figure 1
Homebuilding Warranties:
Claims Paid per Quarter by U.S.-based Builders
(in millions of U.S. dollars, 2015-2024)
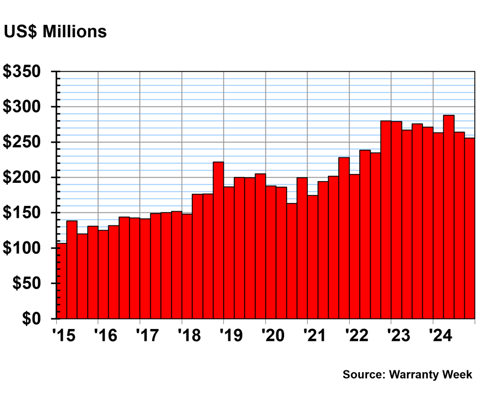
The new home builders reported a total of $1.071 billion in warranty claims paid in 2024, a -2% decrease from 2023.
In 2024, homebuilders paid the most in claims during the second quarter, a total of $288 million, a 8% increase from the second quarter of 2023. The lowest amount of claims paid was during the fourth quarter, where the homebuilders paid a collective $256 million, a -6% decrease from the fourth quarter of 2023.
Hovnanian saw claims costs increase by 45% from 2023 to 2024, from $22 million to $32 million. Meritage saw claims costs increase by 22%, from $21 million in 2023 to $25 million in 2024.
Toll Brothers saw claims decrease by -33%, from $75 million in 2023 to $50 million in 2024. Dream Finders saw claims decrease by -27%, from $9 million in 2023 to $7 million in 2024. Cavco saw claims decrease by -24%, from $81 million in 2023 to $62 million in 2024.
Warranty Accrual Totals
Figure 2 shows the amount of warranty accruals set aside by the homebuilders, from 2015 to 2024.
Figure 2
Homebuilding Warranties:
Accruals Made per Quarter by U.S.-based Builders
(in millions of U.S. dollars, 2015-2024)
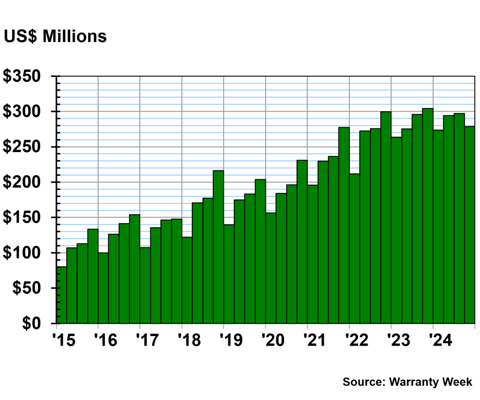
In 2024, the new home builders set aside $1.144 billion in warranty accruals, a 0.4% increase from 2023.
The industry set aside the largest amount of warranty accruals in the third quarter of 2024, with a total of $297 million, a 1% increase from the third quarter of 2023. And the smallest accrual total came in the first quarter of 2024, when the industry set aside, $274 million, a 4% increase from the first quarter of 2023.
Hovnanian increased its warranty accruals by 40% from 2023 to 2024, from $14 million to $19 million. Green Brick increased accruals by 22%, from $10 million in 2023 to $13 million in 2024. M.D.C. Holdings increased accruals by 16%, from $24 million to $28 million.
Cavco decreased accruals by -27%, from $87 million in 2023 to $64 million in 2024. Toll Brothers decreased its accruals by -19%, from $45 million in 2023 to $36 million in 2024.
Warranty Reserve Balances
Figure 3 shows the quarterly end-balance of the warranty reserve funds of each homebuilder, from 2015 to 2024.
Figure 3
Homebuilding Warranties:
Reserves Held per Quarter by U.S.-based Builders
(in millions of U.S. dollars, 2015-2024)
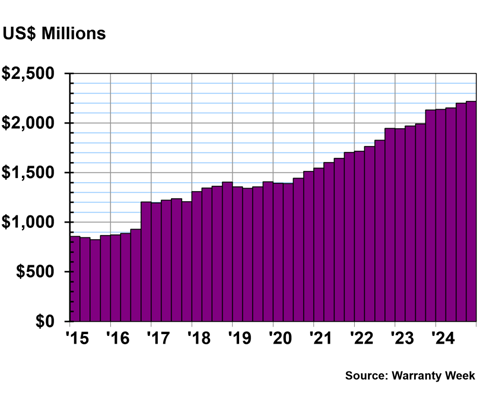
The homebuilders held a collective $2.219 billion in warranty reserves at the end of 2024, a 4% increase from the end of 2023.
A new record high has been set for this metric in every quarter since the second quarter of 2023.
Dream Finders increased its reserve end-balance by 34%, from $21 million at the end of 2023, to $28 million at the end of 2024. LGI Homes increased its reserve end-balance by 18%, from $24 million at the end of 2023 to $16 million at the end of 2024.
Green Brick decreased its reserve end-balance by -26%, from $23 million at the end of 2023, to $17 million at the end of 2024.
Accruals Per Home Sold
Figure 4 shows the average accrual rate per home sold across the homebuilder industry, for 22 years of quarterly data, from 2003 to 2024.
Figure 4
Homebuilding Warranties:
Average Warranty Accruals Made per Unit Sold
(in U.S. dollars, 2003-2024)
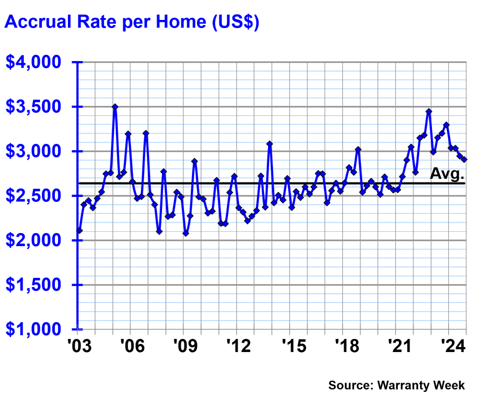
Over 22 years, an average of $2,639 in quarterly warranty accruals were set aside per new home sold in the United States.
In 2024 overall, the average amount of accruals per home sold was $2,980. The industry has accrued above the 22-year average during every quarter since the first quarter of 2021. We can see in Figure 4 that this is a deviation from the previous pattern of hovering right around that average, as we saw from about 2007 until 2021.
Accrual Rates for Specific Builders
Figures 5 through 10 show the average quarterly amount of accruals made per home sold for each of the 22 site-built homebuilders. These companies are grouped by their minimums and maximums, so pay attention to the changing y-axis scales in these charts.
Figure 5 shows the companies with the largest maximums, and thus the most volatile of the bunch. By contrast, Figure 10 has the smallest y-axis scale, and shows the homebuilders with the least volatile warranty accrual behavior.
Figure 5
Homebuilding Warranties:
Warranty Accruals Made per Unit Sold
(in U.S. dollars, 2003-2024)
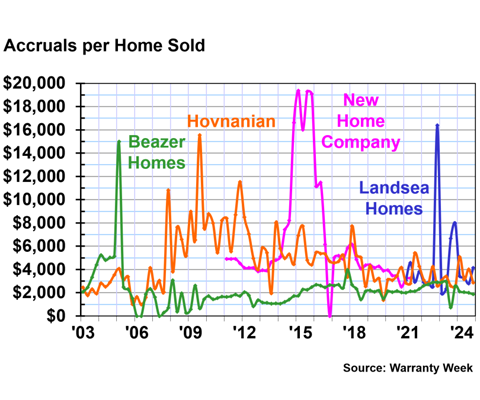
New Home Company was acquired by private equity firm Apollo Global Management in 2021, and ceased reporting. We can consider that company a cautionary tale in what happens to homebuilders that let their warranty accruals and costs get out of control.
Beazer Homes and Hovnanian represent two companies that did get their warranty accruals under control, after some trouble before and during the Great Recession. However, Hovnanian still experiences more variability in this metric than most. In the first quarter of 2024, Hovnanian accrued $5,094 per home sold, and in the fourth quarter of 2024, Hovnanian accrued $2,869 per home sold. That's a much larger range than we saw from the company in 2023.
Landsea has seen two significant spikes in accruals per home sold, in the fourth quarter of 2022, and more recently in the third and fourth quarters of 2023. Landsea ranged from $2,793 accrued per home sold in the third quarter of 2024, to $4,142 per home sold in the fourth quarter.
Figure 6
Homebuilding Warranties:
Warranty Accruals Made per Unit Sold
(in U.S. dollars, 2003-2024)
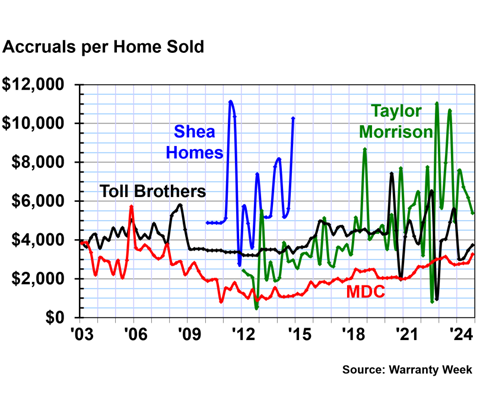
While Beazer Homes and Hovnanian have smoothed out their oscillations in this metric in recent years, Taylor Morrison and Toll Brothers have seen the volatility in this metric grow.
Taylor Morrison's accruals per home sold have gotten less predictable since 2020, with especially large increases in the fourth quarter of 2022 and the third quarter of 2023. The company ranged from $7,567 in accruals per home sold in the first quarter of 2024, to $5,381 per home sold in the fourth quarter.
Toll Brothers has also varied its quarterly accruals per home sold greatly in recent years, but was relatively tame in 2024. Toll Brothers accrued $3,021 per home sold in the first quarter of 2024, and $3,730 per home sold in the fourth quarter.
Shea Homes is another cautionary tale, and was acquired by a private investor in 2014.
M.D.C., on the other hand, has kept this metric smooth for almost two decades now. In the first quarter of 2024, M.D.C. accrued $2,765 per home sold, and in the fourth quarter, the company accrued an average of $3,260 per home sold.
Figure 7
Homebuilding Warranties:
Warranty Accruals Made per Unit Sold
(in U.S. dollars, 2003-2024)
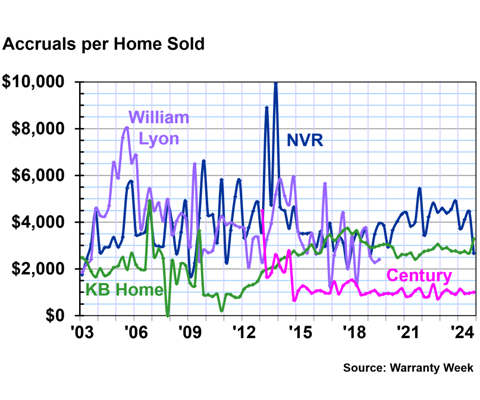
NVR, KB Home, and Century are four more homebuilders that started out with a lot of volatility in this metric, but have relatively smoothed out in recent years.
William Lyon is another example of a company that never got its warranty costs per home sold under control. William Lyon was acquired by Taylor Morrison (Figure 6) at the end of 2019. If you look back to Figure 6, you may notice that Taylor Morrison's warranty accruals per home sold have become much less predictable since right around the same period, the beginning of 2020.
NVR's accruals per home sold in 2024 ranged from $4,447 in the third quarter, to $2,662 in the fourth quarter. KB Home's accruals per home sold ranged from $3,277 in the fourth quarter, to $2,680 in the third quarter. And Century's accruals per home sold ranged from $1,132 in the first quarter, to $944 in the second quarter.
Figure 8
Homebuilding Warranties:
Warranty Accruals Made per Unit Sold
(in U.S. dollars, 2003-2024)
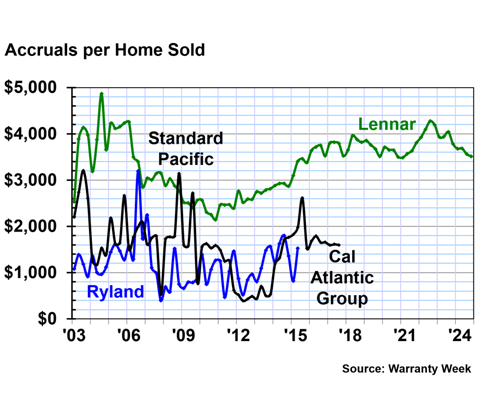
Figure 8 is really the family tree of one company, Lennar Corp., which acquired all the others in the chart. Standard Pacific Homes and Ryland Group merged in 2015, and changed their name to CalAtlantic Group. In 2018, Lennar acquired CalAtlantic.
Lennar is one of the largest homebuilders in this report, along with D.R. Horton, found in Figure 10, and PulteGroup, found in Figure 9. It's not a coincidence that the three largest homebuilders in the U.S. all have warranty accruals per home sold that fall on the less volatile side of the spectrum, compared to the companies we've just looked at.
Unlike what we saw with Taylor Morrison's acquisition of William Lyon, Lennar has absorbed a company with more volatile warranty accrual habits, and smoothed out that instability.
In the fourth quarter of 2024, Lennar accrued $3,510 per home sold. In the first quarter, Lennar accrued $3,678 per home sold.
Figure 9
Homebuilding Warranties:
Warranty Accruals Made per Unit Sold
(in U.S. dollars, 2003-2024)
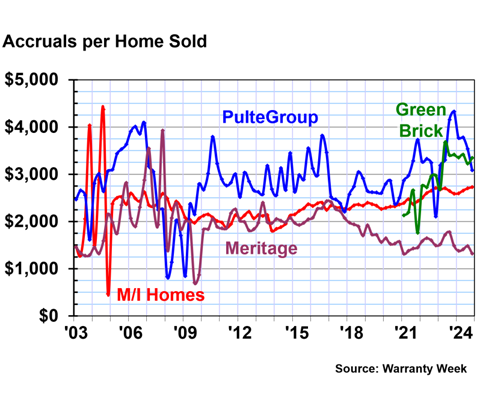
Compared to Meritage and M/I Homes, PulteGroup looks to have more volatility in its warranty accruals in recent years. Certainly, PulteGroup's line oscillates more than those in Figures 7 and 8, but the company is still smoother than any of those in Figures 5 or 6.
PulteGroup accrued $3,082 per home sold in the fourth quarter of 2024, on the low end, and $3,781 per home in the second quarter, on the high end.
Meritage ranged from $1,322 in the fourth quarter, to $1,479 in the third quarter. M/I ranged from $2,595 in the first quarter, to $2,728 in the fourth quarter.
Green Brick is newer to reporting. The company accrued $3,224 per home sold in the third quarter of 2024, and $3,417 per home sold in the second quarter.
Figure 10
Homebuilding Warranties:
Warranty Accruals Made per Unit Sold
(in U.S. dollars, 2003-2024)
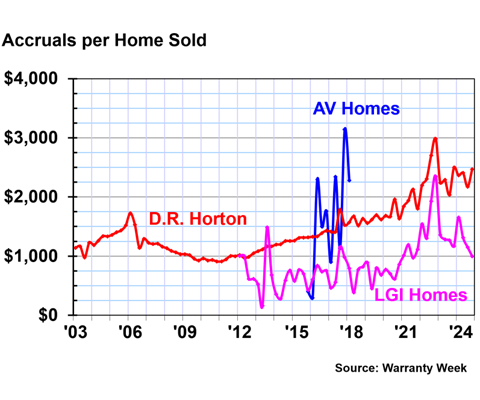
Figure 10 shows the companies with the lowest ranges of quarterly accruals per home sold over their whole period of reporting.
Taylor Morrison acquired AV Homes in 2018, around the same time the company acquired William Lyon.
D.R. Horton accrued $2,467 per home sold in the fourth quarter of 2024, and $2,171 per home sold in the third quarter. LGI Homes accrued $1,653 million per home in the first quarter, and $998 million in the fourth quarter.