Twenty-Second Annual Product Warranty Report:
In 2024, the over 1,400 U.S.-based, warranty-issuing manufacturers we track paid an average of 1.329% of their total product sales revenue on warranty claims, and an average of 1.333% of their sales revenue on warranty accruals. Companies in the vehicle, electronics, and building trade sectors set aside $31.041 billion in warranty accruals, paid $29.176 billion in warranty claims, and collectively held $60.839 billion in warranty reserves at the end of the year.
The SEC annual report filing deadline for large companies was March 3, and the deadline for all filers was March 31. We've gathered data from all but a small handful of manufacturers that will file late, or perhaps not at all. And we can say with confidence that we've gathered over 99% of all available product warranty expense data from U.S.-based, warranty-issuing manufacturers. For the twenty-second consecutive year, we are happy to present our Annual Product Warranty Report.
For over two decades, we've tracked the product warranty expenses of over 1,400 U.S.-based manufacturers. This week, we're kicking off our series of 22-year charts with this overview of product warranty expenses by industry group. Over the coming months, we will delve deeper into the expenses of the companies comprising each of these industries.
The U.S. Securities and Exchange Commission (SEC) and the Financial Accounting Standards Board (FASB) Accounting Standards Codification (ASC) require all publicly-trading companies to disclose the amounts they pay in warranty claims, set aside in warranty accruals, hold in warranty reserves, and changes of estimate when they over- or under-accrue for expected payments.
FASB introduced the first version of rules requiring manufacturers to report their product warranty expenses back in 2003, as part of a wave of accounting reforms that were born out of the Enron scandal. Since then, we've been tracking and analyzing these data, and reporting them to our readers.
Methodology
This newsletter compiles all of the product warranty expenses that are reported to the SEC, but we acknowledge that there are some gaps in which data are available, including private companies, and those which may not be in compliance, including several large American consumer electronics manufacturers. Apple stopped reporting in 2022, and Microsoft stopped reporting in 2013. There are a few publicly-traded, U.S.-based manufacturers that do not report, and never did, such as Google. And, of course, these data are from U.S.-based manufacturers, excluding American companies owned by foreign-based parent companies, including, Chrysler, owned by Netherlands-based Stellantis, and GE Appliances, owned by China-based Haier.
Each of the over 1,400 warranty-issuing, U.S.-based manufacturers reported warranty expenses for at least some period from 2003 to 2024, but not all reported in 2024. We regularly peruse each company's annual reports and quarterly financial statements, and record three key warranty metrics: the amount of claims paid, the amount of accruals made, and the end-balance of the warranty reserve fund.
We also record each manufacturer's product revenue. We gather these data from either the income statement, or the revenue segmentation footnotes, so we can identify a figure that best represents the revenue generated from the sale of products that come with manufacturer's warranties attached.
We use these data to calculate our two warranty expense rates: claims as a percentage of sales revenue (the claims rate), and accruals as a percentage of sales (the accrual rate).
Based on their primary product line, each manufacturer in this report is assigned to one of three sectors: vehicles, electronics, or building trades. Within those sectors, each company is assigned to one and only one of 18 possible industry groups, such as cars & cycles, truck & bus, consumer electronics, power generation equipment, appliances & HVAC, and new home builders.
There was one large manufacturer that changed category: General Electric Co., now known as GE Aerospace. In early 2024, GE finalized the split into three companies, GE HealthCare (medical & scientific equipment), GE Vernova (power generation equipment), and GE Aerospace. Recently, each new spin-off published their own segmented product warranty figures dating back to 2022. So we removed the 2022 and 2023 General Electric Co. numbers from the power generation equipment industry group, and replaced them with the GE HealthCare numbers in the medical & scientific equipment group, GE Vernova numbers in the power generation group, and GE Aerospace numbers in the aerospace group.
The deadline to file annual reports with the SEC was March 31, but as of April 7, 2025, there were still 12 warranty-reporting manufacturers that were late to report: Blink Charging Co., Dixie Group Inc., DZS Inc., Gencor Industries Inc., Kopin Corp., Nikola Corp., Pacific Green Technologies Inc., Phoenix Motor Inc., Sunation Energy Inc., Trans Lux Corp., Trimble Inc., and Vislink Technologies Inc. Since the warranty expenses of these 12 companies amount to a rounding error in the scale of our data, we did not insert placeholder estimates for the missing data into the annual totals.
In addition, several companies were acquired, went private, or went bankrupt in 2024. The ten largest were: Bowflex Inc. (filed Chapter 11 bankruptcy in March 2024), Circor International Inc. (acquired by private equity firm KKR & Co. Inc. in late 2023), Eargo Inc. (acquired by private equity firm Patient Square Capital in January 2024), Evoqua Water Technologies Corp. (acquired by Xylem Inc. in May 2023), Invacare Holdings Corp. (acquired by MIGA Holdings), Kimball International Inc. (acquired by HNI Corp. in mid-2023), Lightning eMotors Inc. (entered into an asset purchase agreement to avoid bankruptcy), PGT Innovations Inc. (acquired by private company Miter Brands), Proterra Inc. (filed Chapter 11 in mid-2023), and SunPower Corp. (filed Chapter 11 in August 2024).
Vehicle Warranty Accruals
In total, U.S.-based manufacturers set aside $31.041 billion in warranty accruals in 2024, a 10% increase from 2023's total of $28.113 billion.
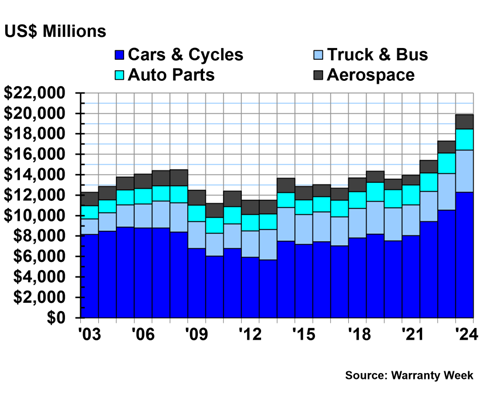
The vehicle sector accounted for 67% of those warranty accruals, a total of $20.900 billion across four industry groups.
The vehicle sector in this report is comprised of four industry groups: cars & cycles, which includes manufacturers of passenger cars, motorcycles, boats, ATVs, and other light-duty vehicles; truck & bus, which includes manufacturers of agricultural and construction equipment as well as heavy-duty, on-highway trucks; auto parts, including suppliers of powertrain components and other auto parts; and aerospace, including airframe OEMs, jet engine manufacturers, and avionics parts suppliers.
Figure 1 shows the total annual warranty accruals made by the U.S.-based vehicle sector from 2003 to 2024.
Figure 1
Worldwide Warranty Accruals Made
by U.S.-based Vehicle Manufacturers
(accruals made in US$ millions, 2003-2024)
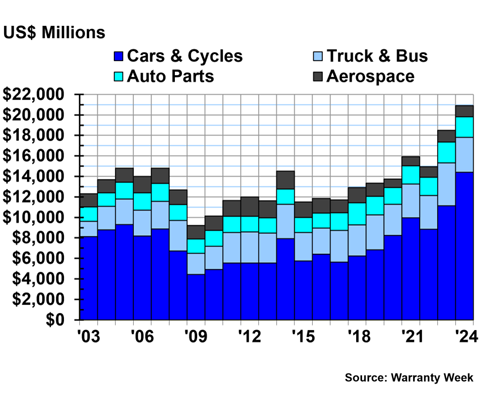
The cars & cycles industry set aside $14.396 billion in warranty accruals in 2024, a 29% increase from 2023's total of $11.129 billion. We can see in Figure 1 that warranty accruals in the small vehicle industry have been on a meteoric rise since 2022, and $14 billion is by far the largest accrual total we've ever seen from the industry. We'll be delving into the expenses of the entire cars & cycles industry in a coming newsletter, but take a look at our February 27, 2025 newsletter "U.S. Auto Warranty Annual Reports" for a deep dive on the warranty expenses of the three largest manufacturers in this category.
The truck & bus industry accrued a total of $3.412 billion in 2024, a -19% decrease from 2023's total of $4.196. 2023's total was the record high for the industry.
The auto parts industry accrued a total of $2.017 billion in 2024, a -1% decrease from the year prior.
The aerospace industry accrued a total of $1.075 billion in 2024, a -6% decrease from 2023.
Overall, although total accruals decreased for three out of the four industry groups, the increase in the cars & cycles industry was large enough to bring the vehicle sector's total warranty accruals to a new record high for the second year in a row.
Electronics Warranty Accruals
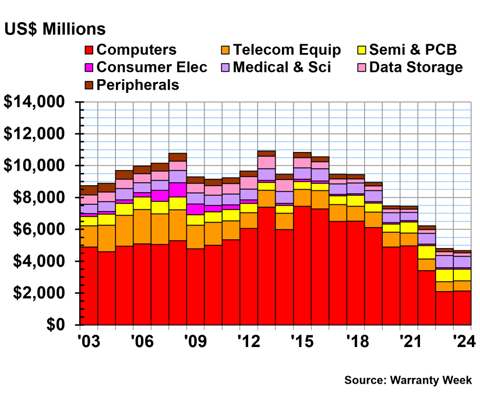
The high-tech electronics sector accounted for 18% of the total warranty accruals made by U.S.-based manufacturers in 2024, a total of $5.433 billion.
The electronics sector is comprised of seven industry groups: computers, telecom equipment, semiconductors & PCB, consumer electronics, medical & scientific equipment, data storage, and peripherals.
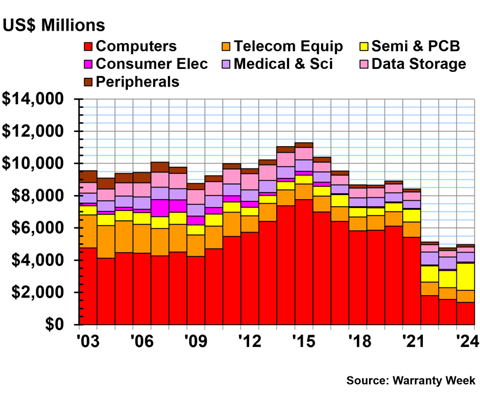
Figure 2 shows the total warranty accruals made by each industry group in the electronics sector, from 2003 to 2024. Keep in mind that we can only collect data that are reported to the SEC; thus, we don't have data from Google, our data from Microsoft ends in 2013, and our data from Apple ends in 2022.
Figure 2
Worldwide Warranty Accruals Made
by U.S.-based Electronics Manufacturers
(accruals made in US$ millions, 2003-2024)
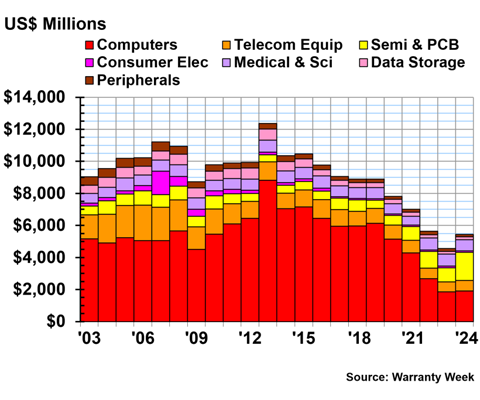
The computers industry accrued $1.915 billion in 2024, a 3% increase from 2023's total of $1.859 billion. The largest manufacturers in this industry include HP Inc. and Dell Technologies Inc.
The semiconductor & PCB industry accrued $1.743 billion in 2024, just about double 2023's total of $878 million. This increase is almost entirely explained by GPU manufacturer Nvidia Corp. octupling its accruals from $109 million in 2023 to $948 million in 2024. Nvidia also had the largest accrual rate increase from 2023 to 2024 among the Top 100 manufacturers.
The U.S.-based consumer electronics industry accrued $106 million, a 1% increase from 2023. Again, because of gaps in reporting and compliance, the largest companies that report their warranty expenses are Garmin Ltd. and GoPro Inc.
The telecom equipment industry accrued $658 million in 2024, a 7% increase from the year prior. The medical & scientific equipment industry accrued $685 million, a -9% decrease from the year prior. The data storage industry accrued $178 million, a 13% increase. And the peripherals industry accrued $148 million, a -19% decrease.
Building Trade Warranty Accruals
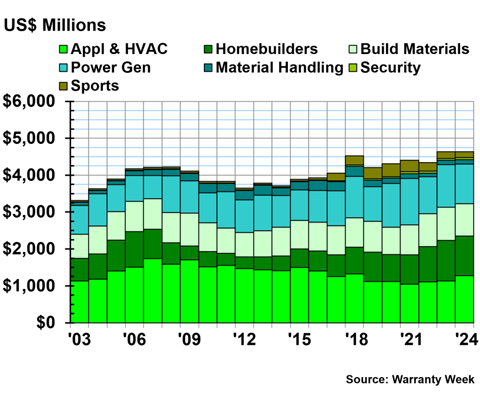
The building trades sector accrued a total of $4.708 billion, 15% of the total set aside by U.S.-based manufacturers in 2024.
The building trades consist of seven industry groups: appliances & HVAC, new home builders, building materials, power generation equipment, material handling, security, and sports.
The sports category includes manufacturers of recreational equipment including hunting and camping gear, golf clubs, ping-pong tables, dart boards, in-ground swimming pools, and elliptical machines. However, this group also serves as a catch-all for companies that are a little more difficult to categorize, including manufacturers of jewelry, watches, crafting machines, vapes and e-cigarettes, and equipment for indoor cannabis cultivation (a different type of recreation, if you will).
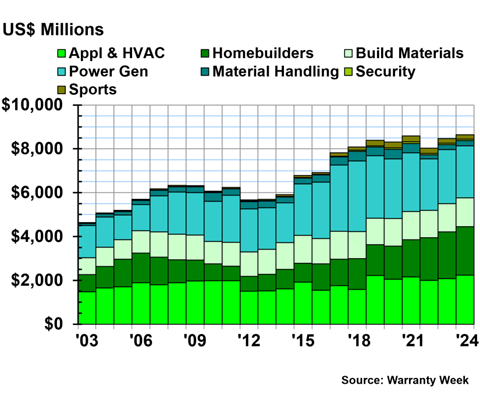
Figure 3 shows the total warranty accruals of the building trade manufacturers, from 2003 to 2024.
Figure 3
Worldwide Warranty Accruals Made
by U.S.-based Building Trade Manufacturers
(accruals made in US$ millions, 2003-2024)
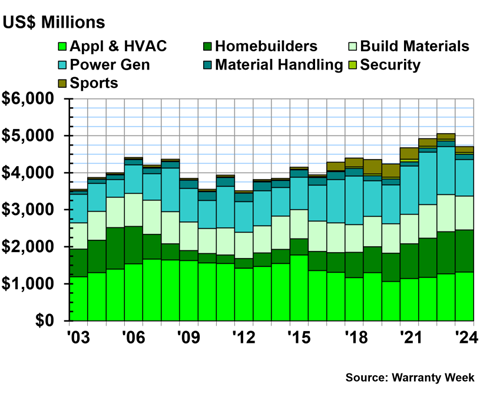
The power generation industry saw the largest change in total warranty accruals among the building trades in 2024. The power generation equipment industry accrued $994 million in 2024, a -24% decrease from 2023.
The appliance & HVAC industry accrued a total of $1.313 billion in 2024, a 3% increase from the year prior. The new home builders accrued $1.144 billion in 2024, a minute 0.4% increase. And the building materials industry accrued a total of $909 million, a -9% decrease.
The material handling industry accrued $137 million in 2024, a -8% decrease from 2023. The security industry accrued $52 million, a -3% decrease. And the sports industry accrued $159 million, a 9% increase.
Warranty Expense Rates
The dollar amounts we've presented only tell part of the story, especially in recent years, with inflation driving up the cost of warranty repairs, but also driving up the sell price of the products to which those warranties are attached.
Warranty accruals are supposed to remain in proportion to product sales, unless there's been a significant change in reliability or repair cost. Ideally, warranty claims payments will remain proportional to product sales revenue as well.
Because these are ratios, the impact of inflation should be minimized, and Figure 4 can reveal to us if the 10% increase in total U.S.-based warranty accruals, and the 9% increase in warranty claims, is in proportion to increases in product sales revenue, or if warranty really is costing manufacturers a larger proportion of their total revenue.
Figure 4 shows the average quarterly claims and accrual rates among all of the warranty-issuing manufacturers based in the United States, from 2003 to 2024.
Figure 4
All U.S.-based Companies
Average Warranty Claims & Accrual Rates
(as a % of product sales, 2003-2024)
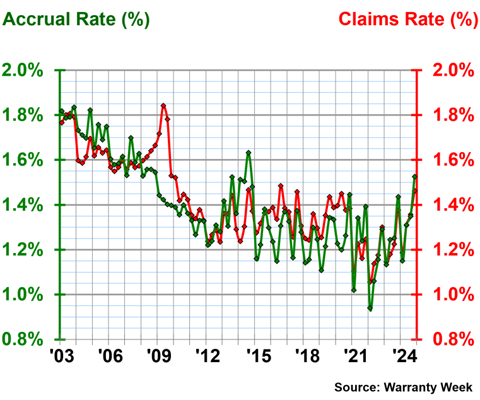
Over 22 years, the overall average warranty claims rate was 1.42%, with a standard deviation of 0.18%, and the average warranty accrual rate was 1.40%, with a standard deviation of 0.20%.
In 2024, the average claims rate was 1.33%, and the average accrual rate was 1.33%. On a quarterly basis, the average claims rate ranged from 1.19%, in the first quarter, to 1.46%, in the fourth quarter. The average accrual rate ranged from 1.15% in the first quarter, to 1.53% in the fourth quarter.
Warranty Claims Totals
Manufacturers choose how much they set aside in warranty accruals, so we've highlighted the metric in this newsletter. But, we will briefly present and summarize the total warranty claims paid, and warranty reserve end-balances, for the three sectors.
In 2024, U.S.-based manufacturers paid a total of $29.176 billion in warranty claims, up 9% from 2023.
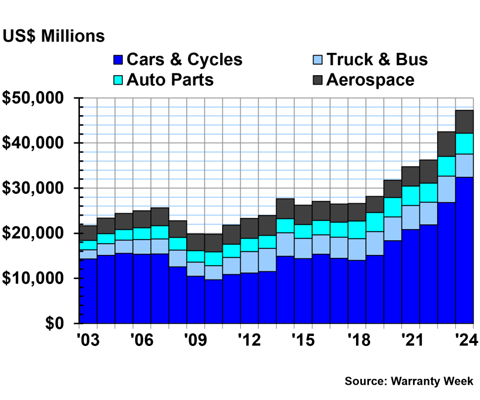
The vehicle sector comprised 68% of that total, or $19.869 billion in warranty claims paid in 2024. Figure 5 breaks down warranty claims in the vehicle sector by industry group, from 2003 to 2024.
Figure 5
Worldwide Warranty Claims Paid
by U.S.-based Vehicle Manufacturers
(claims paid in US$ millions, 2003-2024)
In 2024, the cars & cycles industry paid $12.285 billion in warranty claims, a 17% increase from 2023. The truck & bus industry paid $4.128 billion in 2024, a 15% increase from the year prior. The auto parts industry paid $2.058 billion, a 3% increase. And the aerospace industry paid $1.398 billion, a 19% increase.
It's interesting to note that total claims costs increased for every industry group in the vehicle sector in 2024, while three of the four decreased their accruals.
Figure 6 shows the total warranty claims paid by the electronics sector, from 2003 to 2024.
Figure 6
Worldwide Warranty Claims Paid
by U.S.-based Electronics Manufacturers
(claims paid in US$ millions, 2003-2024)
In 2024, the electronics sector paid a total of $4.668 billion in warranty claims, 16% of the U.S. total.
The computer industry paid $2.129 billion in warranty claims, a 2% increase from 2023.
The semiconductor & PCB industry paid $724 million in warranty claims in 2024, a -7% decrease from the year prior. The medical & scientific equipment industry paid $698 million in claims, a decrease of -8%. And the telecom equipment industry paid $645 million, an increase of 2%.
The data storage industry paid $218 million in claims in 2024, a -12% decrease from 2023. The peripherals industry paid $152 million, a -19% decrease. And the consumer electronics industry paid just $102 million, a 2% increase.
Figure 7 shows the total warranty claims paid by the building trades sector, from 2003 to 2024.
Figure 7
Worldwide Warranty Claims Paid
by U.S.-based Building Trade Manufacturers
(claims paid in US$ millions, 2003-2024)
The building trades sector paid a total of $4.639 billion in warranty claims in 2024, comprising 16% of the U.S. total.
The appliance & HVAC industry paid $1.279 billion in warranty claims in 2024, a 13% increase from the year prior. The new home builders paid $1.071 billion, a -2% decrease. The power generation equipment manufacturers paid $1.077 billion in warranty claims, a -6% decrease. And the building materials manufacturers paid $874 million, a -3% decrease.
The sports industry paid $164 million in claims in 2024, a -11% decrease from 2023. The material handling industry paid $117 million in claims, a -4% decrease. And the security industry paid $56 million in 2024, an 18% increase from the year prior.
Warranty Reserve Balances
Our final metric is the year-end-balance of the warranty reserve fund of each U.S.-based manufacturer, grouped based on sector and industry.
As of December 31, 2024, the warranty-issuing U.S.-based manufacturers held a collective $60.839 billion in warranty reserves, a 9% increase from the end of 2023. This is a new record high that exceeds the old record high by over $5 billion.
Of $60.839 billion, 78% comes from the vehicle sector, 8% is from the electronics sector, and 14% is from the building trades sector.
Figure 8 shows the total warranty reserves held by the vehicle sector, by industry group, from 2003 to 2024.
Figure 8
Worldwide Warranty Reserves
Held by U.S.-based Vehicle Manufacturers
(reserves held in US$ millions, 2003-2024)
The cars & cycles industry held $32.412 billion in warranty reserves at the end of 2024, a 21% increase from the end of 2023. That's a $5.582 billion increase in total reserves held across the cars & cycles industry in just a year.
The auto parts industry also saw its total reserves increase from the end of 2023 to the end of 2024. The auto parts industry held $4.659 billion in reserves at the end of 2024, a 6% increase from the year prior.
The truck & bus industry held $5.133 billion at the end of 2024, a -12% decrease from the end of the year prior. The aerospace industry held $5.037 billion at the end of 2024, a -7% decrease.
Figure 9 shows the warranty reserves end-balances of the electronics sector, by industry, from 2003 to 2024.
Figure 9
Worldwide Warranty Reserves
Held by U.S.-based Electronics Manufacturers
(reserves held in US$ millions, 2003-2024)
The total reserves held in the electronics sector decreased dramatically from 2021 to 2022 due to Apple ceasing reporting its warranty expenses.
At the end of 2024, the semiconductor industry held $1.691 billion in reserves, a 58% increase from the end of the year prior. The computer industry held $1.385 billion, a -11% decrease.
The telecom equipment industry held $738 million, up 2%. The medical & scientific equipment industry held $601 million, a -21% decrease.
The data storage industry held $329 million, down -17%. The peripherals industry held $142 million, down -13%. And the consumer electronics industry held $76 million, up 4%.
Figure 10 shows the reserves end-balances for the building trades sector, from 2003 to 2024.
Figure 10
Worldwide Warranty Reserves
Held by U.S.-based Building Trade Manufacturers
(reserves held in US$ millions, 2003-2024)
At the end of 2024, the power generation equipment manufacturers held a collective $2.366 billion in warranty reserves, a decrease of -4% from the year prior. The appliance & HVAC manufacturers held $2.232 billion, an increase of 8%. The new home builders held $2.219 billion, an increase of 4%. And the building materials manufacturers held $1.316 billion, up 2%.
The material handling industry held $239 million in reserves, up 11%. The sports industry held $194 million, down -6%. And the security industry held $70 million, down -6%.