Worldwide Auto Warranty Report:
In 2023, the global automotive manufacturers paid $51 billion in warranty claims, with an average claims rate of 1.98%, and set aside $65 billion in warranty accruals, with an average accrual rate of 2.52%. At the end of 2023, the worldwide automakers held a total of $140 billion in warranty reserves.
In 2023, the global automotive industry saw significant increases in three of our five key warranty metrics: claims paid, accruals made, and reserves held. Global automotive product warranty claims paid and accruals made both grew by 17% from 2022 to 2023, while warranty reserves held by global automotive manufacturers increased by 14%. At the same time, the industry average claims and accrual rates increased only slightly, meaning vehicle sales revenue grew parallel to increases in warranty costs.
Warranty Week tracks the warranty expenses of 34 major automotive manufacturers around the world, which report some or all of their warranty metrics to investors in their annual reports. Most report the amount they pay in claims, the amount of accruals they make, and the end-balance of the warranty reserve fund.
Some report only the amount they hold in warranty reserves at the end of each fiscal year. A few report their reserve balance, along with the amount of warranty accruals they make. For those partial reporters, we fashion estimates for the missing data.
We also fashioned estimates for six more global manufacturers that don't report their warranty expenses at all. That makes a total of 39 manufacturers in this report. For 2023, our hard data account for 97% of warranty claims paid, 95% of warranty accruals made, and 95% of warranty reserves held by all global automakers. That's an even higher level of accuracy than last year's report, thanks to an increasing number of Chinese automakers reporting their warranty expenses.
Methodology
For each vehicle manufacturer, we gathered five metrics from each of their annual reports: the amount of product warranty claims paid, the amount of accruals made, the end-balance of the warranty reserve fund, the amount of vehicle sales revenue, and the unit number of vehicles sold.
With the claims, accrual, and product sales revenue data, we calculated our two warranty expense rates: claims as a percentage of sales (the claims rate), and accruals as a percentage of sales (the accrual rate). And with the accruals and unit sales data, we calculated one additional ratio: the amount of accruals made per vehicle sold (in U.S. dollars).
All data were gathered in their native currency, and then translated into U.S. dollars using the exchange rates from the Yearly Average Currency Exchange Rates table published by the U.S. Internal Revenue Service.
We gathered data from 34 passenger car and light truck manufacturers from seven markets.
From the United States, we followed Ford Motor Co., General Motors Co., and Tesla Inc.
While there are a few smaller U.S.-based electric vehicle (EV) OEMs that report their warranty data, such as Lucid and Rivian, they don't yet manufacture or sell enough units for these data to be appropriate for this worldwide report.
From Europe, we collected data from Volkswagen AG, Stellantis N.V., Mercedes-Benz Group AG, Bayerische Motoren Werke (BMW) AG, Renault S.A., Volvo Car AB, Polestar Automotive Holding UK PLC, and Ferrari S.p.A. Seven of the eight report in Euro, while Polestar reports in U.S. dollars, despite being based in Sweden.
Polestar, a luxury EV manufacturer, is a subsidiary of Volvo Cars, which in turn is majority-owned by the China-based Geely Holding Group, also the parent company of Geely Auto. Polestar and Volvo Cars both file their own separate, independent annual reports that do include warranty data, while Geely Auto doesn't report any of its warranty expenses.
From India, and reporting in rupees using the Indian numbering system, we have data from Tata Motors Ltd. and Mahindra & Mahindra Ltd. Tata is the parent company of the UK-based Jaguar Land Rover, but unlike the relationship between Volvo Cars, Polestar, and Geely, Jaguar Land Rover does not file a separate annual report from Tata.
Japan brings in Toyota Motor Corp., Honda Motor Co. Ltd., Subaru Corp., and Mitsubishi Motors Corp. as full reporters of all three warranty metrics. In addition, we have partial data from Nissan Motor Co. Ltd., Mazda Motor Corp., Isuzu Motors Ltd., and Hino Motors Ltd. These four manufacturers report the end-balance of the warranty reserve fund, and the amount of warranty accruals made, but not the amount of claims paid. Since they give us two of the three, we solve for x, and calculate amount of claims. While we're quite confident in these calculations, they are classed as estimates. Each of these eight manufacturers report their warranty expenses in Japanese yen.
The Japanese and Indian manufacturers all use a fiscal year that ends on March 31, three months later than their peers. We do not time-shift these data. For instance, the data from the fiscal year that spanned April 1, 2023 to March 31, 2024 are counted in the 2023 worldwide totals.
Joining them from South Korea, we have data from Hyundai Motor Co. and Kia Motors Corp., both of which report in South Korean won.
And we have a newcomer to the "Worldwide Auto Warranty Report," VinFast Auto Ltd., based in Vietnam and reporting in Vietnamese dong. VinFast makes electric vehicles, both cars and scooters. VinFast is a subsidiary of Vietnamese conglomerate Vingroup JSC.
Finally, from China, we now have ten auto manufacturers reporting their warranty expenses. Six of the ten report all three key warranty metrics: BYD Company Ltd., BAIC Motor Corp. Ltd., Chang'an Automobile Co. Ltd., Li Auto Inc., Nio Inc., and XPeng Inc. In addition, four more report the end-balance of their warranty reserve funds, and the amount of accruals made, but not the amount of claims paid: SAIC Motor Corp. Ltd., Guangzhou Automobile (GAC) Group Co. Ltd., Great Wall Motor Co. Ltd., and Dongfeng Motor Corp. These ten manufacturers all report in Chinese yuan.
Just five of the 39 major global automotive manufacturers that we tracked for this report did not report their warranty expenses in 2023. From Japan, there is Suzuki Motor Corp., and from China, there are China First Automobile Works (FAW) Group Corp. Ltd., Geely Automobile Holdings Ltd., Chery Automobile Co. Ltd., and Anhui Jianghuai Automobile (JAC) Group Corp. Ltd.
Suzuki used to report its warranty expenses, but did not do so for fiscal 2022 or 2023. Since Suzuki does report its annual vehicle sales revenue, we used these, along with the historical warranty data, to craft estimates for Suzuki's 2023 warranty expenses.
For FAW Group, Geely Auto, Chery Auto, and JAC Group, none of which reported their 2023 vehicle sales revenue, we crafted estimates using national industry average claims and accrual rates, along with historical vehicle sales revenue data.
For 2023, our estimates comprised just 3% of warranty claims, 5% of warranty accruals and reserves, 8% of the worldwide vehicle sales revenue, and 11% of unit sales.
Figures 1, 3, and 7 depict the top 11 manufacturers for each warranty metric, with the remaining 28 represented in the "Other" category.
Warranty Claims Totals
In calendar 2023, we estimate that the major global automakers paid a total of $50.952 billion in warranty claims, an increase of 17% from 2022's total. This is the largest industry-wide warranty claims total we've seen since 2017, when Volkswagen's claims costs soared due to the diesel emissions warranty scandal.
Figure 1
Worldwide Auto Manufacturers
Claims Paid per Year
(in millions of U.S. dollars, 2019-2023)
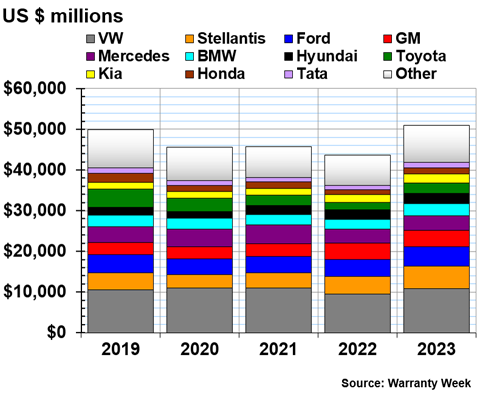
As always, Volkswagen tops the list as the largest warranty claims payer among the worldwide automakers. In 2023, VW paid $10.873 billion in claims, up 15% from 2022's total. 2022 was the only year since 2015 that VW's total claims payments fell below the $10 billion threshold.
Stellantis saw warranty claims costs soar in 2023. The manufacturer paid $5.483 billion in claims in 2023, up 27% from 2022.
However, Stellantis didn't experience the largest increase in warranty claims costs from 2022 to 2023. Honda's total claims paid rose by 29% to $1.573 billion in 2023, and Toyota's rose by 39% to $2.426 billion. BMW's claims payments rose by 26% to $2.894 billion in 2023.
Ford had the third-highest global claims costs in 2023, paying $4.779 billion, an increase of 15% from the year prior.
In the fourth spot is Ford's compatriot General Motors, which saw claims costs fall by -2% to $4.009 billion in 2023. GM is the only manufacturer among the top 11 that saw claims costs fall from 2022 to 2023.
Mercedes-Benz paid $3.655 billion in claims during 2023, up 5% from the year prior. Hyundai paid $2.635 billion, an increase of 9%. Kia paid $2.253 billion, up by 19%. And Tata paid $1.264 billion, an increase of 18% from 2022.
Overall, the 28 manufacturers represented in the "Other" category paid an estimated $9.109 billion in warranty claims during 2023, an increase of 22% from the year prior.
Among the top companies in that category, Tesla, which just missed Figure 1 in the twelfth spot overall, paid $1.225 billion in claims during 2023, an increase of 53% from the year prior. Steep increases in warranty costs aren't unfamiliar to Tesla, which has experienced quite a bit of growth in the global market over the last few years.
Other notable increases in claims costs include Tesla's EV competitor BYD, which paid $396 million in claims during 2023, an increase of 42% from the year prior; Chinese compatriot Changan, which paid $151 million, a 38% increase from 2022; and Renault, which paid $767 million, an increase of 34% from the year prior.
Warranty Claims Rates
In order to normalize for each manufacturer's vehicle sales revenue, we calculated the claims rates for 31 of the top global automotive OEMs, displayed in Figure 2.
Claims rates are particularly useful to help us parse out whether rampant product failure or overall growth in sales are driving up warranty costs. Often, especially with the burgeoning EV manufacturers, increases in total warranty claims and accruals naturally follow increases in vehicle sales.
As we can see in Figure 2, the industry-wide average claims rate was 2.0% in 2023. This is a weighted average calculated by taking all of the total industry-wide claims, divided by all of the total vehicle sales revenue, rather than taking a mathematical average of the 31 percentages.
Figure 2
Worldwide Auto Manufacturers
Average Warranty Claims Rates
(as a percentage of sales, 2022 & 2023)
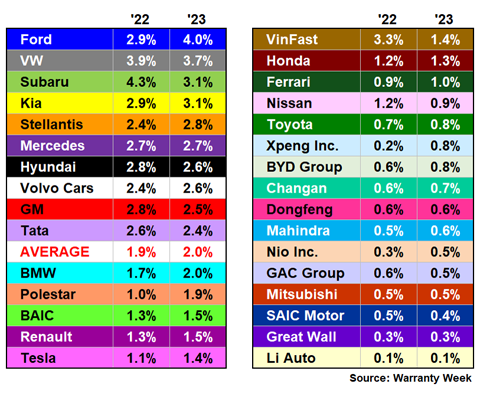
Ford had a rather difficult go with warranty claims costs during 2023. Ford's claims rate rose from 2.9% in 2022 to 4.0% in 2023, a very sharp curve.
Other manufacturers that saw lesser, but still notable, increases in their claims rates are Stellantis, Kia, Polestar, Tesla, Volvo Cars, BAIC, and Renault. Some of these increases, especially Kia and Tesla, make sense considering both manufacturers experienced rather large recall campaigns during 2023.
On the other hand, many manufacturers managed to bring down their claims rate in 2023, despite their total claims costs increasing over the same period.
Subaru saw a significant decrease in its claims rate, from 4.3% in 2022 to 3.1% in 2023. Just before the data frame of Figure 2, in 2021, Subaru had a whopping claims rate of 7.7%, the largest in the industry for that year by far. So this is a huge improvement in Subaru's claims rate over just two years.
VinFast, the Vietnamese EV manufacturer that's making its debut in this year's report, saw its claims rate fall from 3.3% in 2022 to 1.4% in 2023. That's quite a notable improvement considering 2023 was only the company's third year of reporting its warranty expenses, and the entire OEM was only founded in 2017.
Other manufacturers that saw their claims rates decrease from 2022 to 2023 include Volkswagen, Hyundai, General Motors, and Tata.
Note that with the exception of BAIC, all of the Chinese auto OEMs had claims rates below 1% in 2023.
Warranty Accrual Totals
The worldwide automakers set aside a total of $64.822 billion in warranty accruals during calendar 2023, an increase of 17% from the year prior. This is a new record high for the industry, exceeding the previous record from 2015, when the VW emissions scandal first broke.
This time, there's no colossal scandal or recall that drove accruals up. Instead, these figures are mostly a result of good old inflation, along with vehicle sales increasing worldwide.
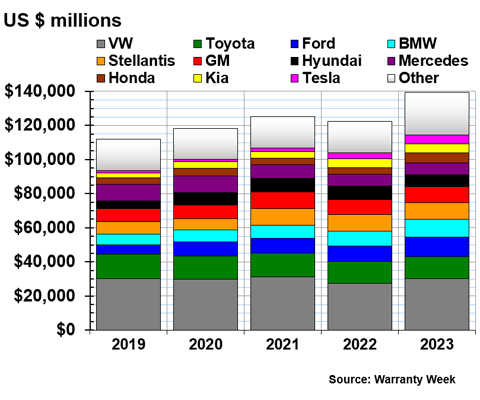
Figure 3 shows the total warranty accruals of the top 11 auto OEMs, along with 28 more represented in the "Other" category, from 2019 to 2023.
Figure 3
Worldwide Auto Manufacturers
Accruals Made per Year
(in millions of U.S. dollars, 2019-2023)
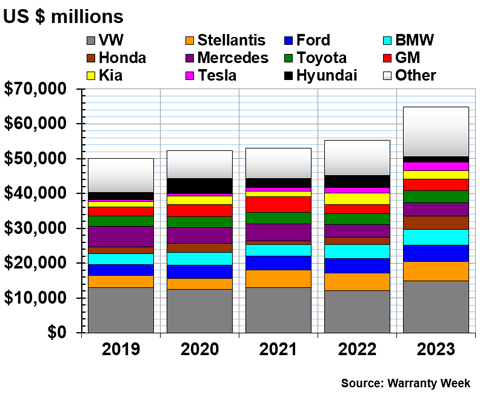
VW accrued a total of $14.971 billion during 2023, an increase of 24% from 2022. This is the highest accrual figure we've seen from the company since 2017, at the tail end of the emissions scandal.
By far, Honda had the largest increase in total warranty accruals from 2022 to 2023 among the global auto OEMs. Honda accrued $3.819 billion in 2023, an increase of 73% from 2022. 2022's total accruals of $2.205 billion were, in turn, more than double the manufacturer's accruals of just $1.078 billion in 2021. So Honda's total warranty accruals have really ballooned over the last few years. Honda had a fiscal 2023 plagued by recalls, including a recall of 4.5 million vehicles globally in December 2023, and another recall of 750,000 vehicles in February 2024.
Tesla, ranked tenth, increased its total accruals by 38% to $2.333 billion in 2023. Tesla recalled almost every vehicle it had ever sold in both the United States and China during December 2023 and January 2024, likely prompting this increase.
GM, ranked eighth, increased its accruals by 27% to $3.282 billion in 2023. Detroit neighbor Ford increased its accruals by 18% to $4.743 billion in 2023.
On the other hand, Hyundai decreased its accruals by half in 2023, to just $1.665 billion, and its compatriot and partially-owned subsidiary, Kia, decreased its accruals by -24% to $2.498 billion, despite both OEMs still being embroiled in an ongoing series of recalls for their Theta 2 engines.
Total accruals among the 28 manufacturers in the "Other" category increased by 40% to $14.182 billion in 2023. Changan increased its accruals by 72% to $409 million, and Renault increased accruals by 59% to $784 million, both quite steep jumps over just a year. In addition, Tata increased accruals by 33% to $1.459 billion, BYD increased accruals by 32% to $1.391 billion, and Subaru increased accruals by 20% to $1.452 billion.
Warranty Accrual Rates
Typically, warranty accruals rise and fall in proportion to sales, since manufacturers directly control this metric. Figure 4, which shows 31 global auto OEMs' accrual rates in 2022 and 2023, helps reveal which increases in total accruals match increases in sales.
Where increases in warranty accruals outpace increases in vehicle sales revenue, the accrual rates increase, and a bit of warranty trouble is revealed. In contrast, those manufacturers that have managed to bring their accrual rates down have achieved savings on warranty expenses overall.
As we can see in Figure 4, the industry average warranty accrual rate was 2.5% in 2023.
Figure 4
Worldwide Auto Manufacturers
Average Warranty Accrual Rates
(as a percentage of sales, 2022 & 2023)
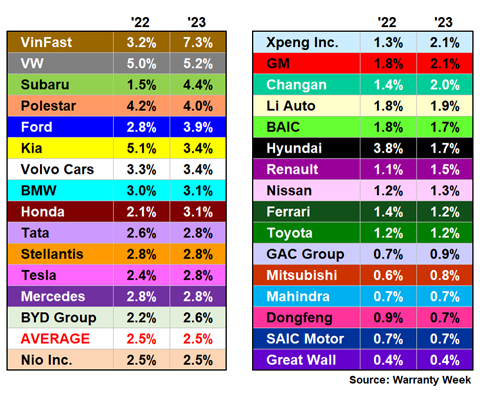
The manufacturer with the highest accrual rate in the industry is none other than our newcomer VinFast, with a very high accrual rate of 7.3%. It's not out of the ordinary for newer EV OEMs to err on the side of caution and over-accrue for future warranty costs; we saw similar from Tesla a few years ago.
VW had the next-highest accrual rate of 5.2%.
Subaru's accrual rate increased significantly, tripling from 1.5% in 2022 to 4.4% in 2023.
Ford's accrual rate also increased rather sharply, from 2.8% in 2022 to 3.9% in 2023. Honda's accrual rate increased from 2.1% in 2022 to 3.1% in 2023.
EV manufacturers Tesla, BYD, and XPeng all increased their accrual rates by notable margins. Tesla increased the accrual rate from 2.4% in 2022 to 2.8% in 2023; BYD increased the accrual rate from 2.2% in 2022 to 2.6% in 2023; and XPeng increased its accrual rate from 1.3% in 2022 to 2.1% in 2023.
Kia managed to decrease its accrual rate from 5.1% in 2022 to 3.4% in 2023, and Hyundai decreased its accrual rate from 3.8% in 2022 to just 1.7% in 2023.
Accruals per Vehicle Sold
Another way to normalize the accrual totals in Figure 3 is to divide them, not by total vehicle sales revenue, as we did in Figure 4, but instead by the total number of vehicle units sold. This gives us an exact dollar amount that each manufacturer puts aside for future warranty costs every time it sells a new vehicle.
For the purposes of this exercise, let's forget that VW also makes heavy-duty trucks under the Navistar and Scania brands, Tata makes commercial vehicles under the Daewoo brand, Honda makes motorcycles, Mahindra makes rickshaws and tractors, VinFast makes electric scooters, and so on. This metric is designed to produce an average warranty cost per vehicle sold, rather than a precise measurement.
This metric also makes the warranty costs of luxury vehicles look expensive, as we'll see with Ferrari in Figure 5a. And it makes the warranty costs of many Chinese vehicles look particularly inexpensive, as we'll see in Figures 5c and 5d.
The following four charts, Figures 5a-5d, are grouped based on ranges of average accruals per vehicle sold, with the vehicles in Figure 5a in the range of $5,000 to $1,400; Figure 5b from $800 to $1,400; Figure 5c from $300 to $600; and Figure 5d from $40 to $300.
Figure 5a
Worldwide Auto Manufacturers
Accruals Made per Vehicle Sold
(in U.S. dollars, 2022 & 2023)
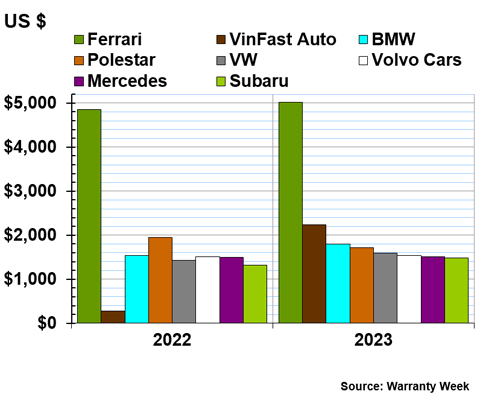
Unsurprisingly, luxury brand Ferrari once again has by far the highest average warranty accruals per vehicle sold, at $5,016.
Next is VinFast, which accrued an average of $2,241 per vehicle, a sevenfold increase from 2022's average of just $284 per vehicle sold. The EV manufacturer is still getting its footing, both in the global market and in the realm of warranty.
Rounding out this list are six more mid-range to luxury brands, BMW, Polestar, Volkswagen, Volvo Cars, Mercedes-Benz, and Subaru.
Note that with the exceptions of VinFast and Subaru, six of the top eight OEMs with the highest average accruals per vehicle sold are European. Especially considering the current landscape of the European auto market, it's interesting to see the tension between more expensive European cars versus cheaper Chinese cars even reflected in the average amount of warranty accruals made by OEMs from the two regions.
Figure 5b
Worldwide Auto Manufacturers
Accruals Made per Vehicle Sold
(in U.S. dollars, 2022 & 2023)
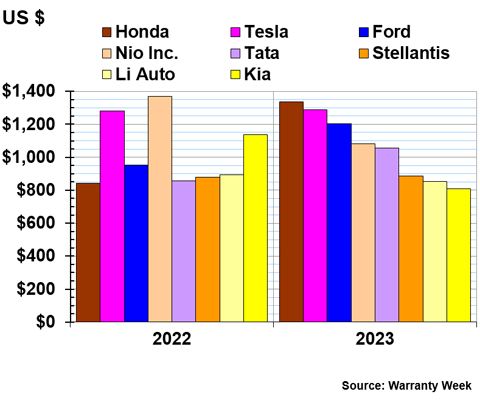
Honda's accruals per vehicle sold increased by about 60% from 2022 to 2023. In 2023, Honda accrued an average of $1,337 for each unit sold.
Tesla accrued an average of $1,290 per vehicle sold, and Ford accrued an average of $1,203 per vehicle. Chinese EV manufacturers Nio and Li Auto both brought down their average accruals per vehicle sold, to $1,080 and $853, respectively. Kia also decreased its accruals per vehicle to $809.
Figure 5c
Worldwide Auto Manufacturers
Accruals Made per Vehicle Sold
(in U.S. dollars, 2022 & 2023)
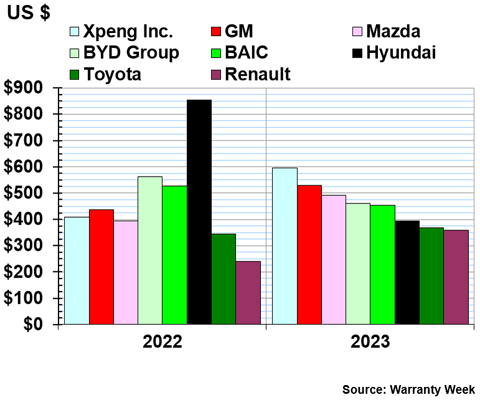
Chinese EV manufacturer XPeng saw average accruals per vehicle sold increase by about 50% to $596 in 2023. GM accrued an average of $530 per vehicle sold, and BYD accrued an average of $460 per vehicle.
Hyundai halved its average accruals per vehicle sold to $395 in 2023. Conversely, Renault increased its accruals per vehicle sold by 50% to $359 in 2023.
Figure 5d
Worldwide Auto Manufacturers
Accruals Made per Vehicle Sold
(in U.S. dollars, 2022 & 2023)
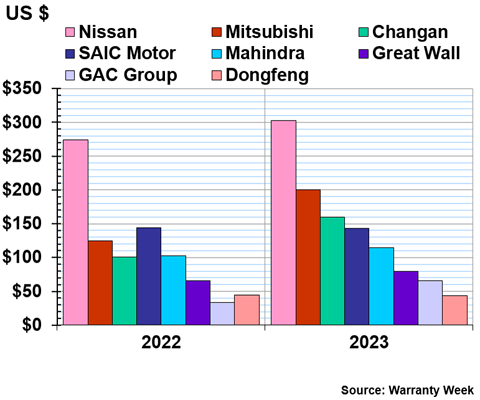
Nissan accrued an average of $303 for each vehicle sold in 2023.
Mitsubishi and Changan both saw their average accruals per vehicle increase by about 60% each in 2023, though both are still at the low end of the range compared to the other global auto OEMs. Mitsubishi accrued an average of $200 per vehicle sold in 2023, while Changan accrued an average of $160 per vehicle.
GAC Group doubled its average accruals per vehicle sold, but still had the second-lowest average among all of the worldwide automakers. GAC accrued an average of just $66 for each vehicle sold in 2023.
Worldwide Average Warranty Expense Rates
Typically, we use 2.5% as the average benchmark for the warranty expense rates in the worldwide automotive industry. However, from 2019 to 2023, we found that the worldwide average claims rate was 2.23%, the average accrual rate was 2.59%, and the combined average of both was 2.41%.
We used the five year average, rather than ten or twenty years, in order to attempt to leave the 2008 recession, the VW emissions scandal, and the Takata airbag recall in the rearview mirror, and get a sense of how the industry has been doing since then.
Figure 6 shows the industry average claims and accrual rates, for all of the manufacturers for which we have hard data. Our estimates are not factored into the averages used to produce this chart.
Figure 6
Worldwide Auto Manufacturers
Average Claims & Accrual Rates
(as a percentage of sales, 2019-2023)
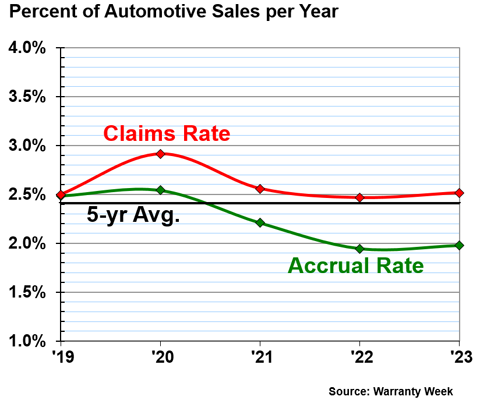
Despite lower sales driving up the warranty expense rates in 2020, Figure 6 shows that the industry average claims and accrual rates have been falling in recent years. This is great news, because it means overall savings on warranty in the worldwide auto industry, a trend that can be confounded by the warranty totals increasing.
Although certain OEMs had warranty trouble in 2022 and 2023, these two years will be remembered for their improvements in product reliability, and savings and efficiency in fulfilling warranty claims.
Warranty Reserve Balances
Our final warranty metric of this worldwide report is the end-balance of each auto manufacturer's warranty reserve fund. For most manufacturers, these figure represent the warranty reserve balance on December 31, 2023, except for the Japanese and Indian OEMs, for which the data represent March 31, 2024.
At the end of fiscal 2023, the global auto industry held a collective $139.456 billion in warranty reserves, an increase of 14% from the end of the year prior.
Figure 7 shows the reserve balance of the top 11 manufacturers, with the other 28 represented in the "Other" category.
Figure 7
Worldwide Auto Manufacturers
Reserves Held at Year's End
(in millions of U.S. dollars, 2019-2023)
At the end of 2023, VW held $30.048 billion in its warranty reserves, a 10% from the year prior.
Toyota had the next-largest warranty reserves, with a total of $13.069 billion, an increase of 2% from the year prior.
Ford and BMW both grew their warranty reserves to exceed those of Stellantis. Ford held $11.504 billion at the end of 2023, an increase of 25% from the year prior, and BMW held $10.444, an increase of 20%. Stellantis held $9.723 billion, a very minor -0.2% decrease.
Honda significantly increased its warranty reserves, growing the fund by 43% in a single year, to a total balance of $5.802 billion. Tesla increased its reserves by 47%, to a total of $5.152 billion.
The 28 manufacturers in the "Other" category held a collective $25.178 billion at the end of 2023, an increase of 36% from the year prior. Among that category, BYD grew its reserves the most by far, increasing the balance by 84% in a single year, to a new total of $2.062 billion.
For more in-depth information about the recalls mentioned in this report, and a zoomed-in look at the 2023 regional auto warranty data (as well as data from the first half of 2024 for the U.S.-based OEMs in the mid-year report), take a look at these newsletters:
- U.S. Auto Warranty Annual Reports
- European Automaker Warranty Expenses
- Japanese Automaker Warranty Expenses
- Mid-Year U.S. Auto Warranty Report
- Top Korean & Indian Automaker Warranty Expenses
- Electric Vehicle Warranty Expense Rates
Consider attending the MapConnected Service & Warranty Lifecycle Summit later this month to see our Publisher, Eric Arnum, present these data, along with exclusive charts, in our much-anticipated presentation, followed by a live Q&A!