U.S. HVAC & Appliance Warranty Report:
Unlike most the other U.S.-based industries we've covered lately, which have seen warranty costs rise due to inflation and recalls, the total warranty expenses of the HVAC & appliance industries have fallen in recent years, due to major mergers and spin-offs.
With heat waves currently hitting the Midwest and East Coast of the United States, as well as the Mediterranean and Balkan regions of Europe, it's a perfect time for us to discuss the warranty expenses of the U.S.-based appliance and HVAC manufacturers. It's especially timely since an air conditioner-related spike in electricity use likely caused a major blackout, which hit Montenegro, Bosnia and Herzegovina, Albania, and the Croatian coast on Friday morning.
Last week's newsletter, "U.S. New Home & Building Materials Warranty Report," took a look at the warranty expenses of all manufacturers associated with new builds, including the homebuilder, building materials, and appliance & HVAC industries. This week, we're zooming in on the appliance & HVAC industry, and breaking down its warranty expenses into the two categories.
The Companies
To create this report, we identified 58 manufacturers that create appliances or HVAC systems, or their components. Of those 58, 26 were manufacturers of commercial and residential heating, ventilation, and air conditioning (HVAC) systems, while the remaining 32 manufacture household or foodservice appliances.
There's been a few major changes to our dataset for this industry over the past decade, which have ironically led to the appliance data being less representative of the global industry, but the HVAC data being more complete.
Appliance Manufacturers
In 2016, the Chinese-based Haier Group acquired GE Appliances from General Electric; Haier retained the "GE Appliances" brand name, but since it's not based in the United States, it does not report its warranty expenses in any financial statements. However, the departure of GE Appliances wasn't a huge loss, because GE never segmented its warranty data, and we couldn't be sure what portion of the total warranty expenses belonged to its appliance division, as opposed to power generation equipment or aerospace.
Electrolux AB, based in Sweden, and Nidec Corp., based in Japan, both report their warranty expenses, but since they're not based in the U.S., don't fit the scope of this report. The same goes for consumer electronics and appliance manufacturers Canon Inc., Hitachi Ltd., Panasonic Corp., and Sony Corp. And there's many more that don't report warranty expenses at all, including LG Corp., Samsung Group, Miele Group, Robert Bosch GmbH, Midea Group, Gree Electric Appliances Inc., and Daikin Industries.
So while this report does provide a good representation of the product warranty costs of U.S.-based appliance manufacturers, it's important to note that the majority of the household appliances being sold at Best Buy or Lowe's, for example, were not produced by U.S.-based companies. Instead, most of the remaining U.S.-based appliance manufacturers produce appliances for commercial kitchens, industrial cooling, or outdoor cooking. Whirlpool, of course, is the exception to that rule.
Of the 32 appliance manufacturers we identified for this report, eight were active and reporting their warranty expenses during 2023. They are: Whirlpool Corp., Middleby Corp., Manitowoc Co. Inc., Newell Brands Inc., Ametek Inc., John Bean Technologies Corp., Traeger Inc., and National Presto Industries Inc.
We don't include any data from GE in this report, due to the lack of segmentation. However, we do include historical data from other formerly independent manufacturers, such as Maytag's data from before Whirlpool acquired it in 2006.
HVAC Manufacturers
On the other hand, our HVAC data has become more precise over the past five years or so, due to a series of mergers and spin-offs.
United Technologies Corp. spun off its HVAC operations into Carrier Global Corp. in early 2020, in advance of its merger with Raytheon Co. to form Raytheon Technologies Corp., recently renamed RTX Corp. So our Carrier Global data isn't entwined with aerospace data, as it was when both were under the same United Technologies umbrella, and not segmented in financial reports. This merger also resulted in the spin-off of elevator manufacturer Otis Worldwide Corp., which we discussed in last week's newsletter on building materials manufacturers.
Also in early 2020, Ingersoll-Rand underwent a complex merger with Gardner Denver Holdings Inc. Gardner Denver acquired the industrial technologies segment of Ingersoll-Rand, along with the name. So the company formerly known as Gardner Denver is now known as Ingersoll Rand Inc. (no hyphen), and the former Ingersoll-Rand, left with its HVAC and refrigeration business, including the Trane and Thermo King brands, renamed itself Trane Technologies plc.
While both of these mergers were finalized in early 2020, they were already in transition during 2019. So in Figures 1, 2, and 5, we see big drops in warranty expense totals for the HVAC industry from 2018 to 2019. So a convenient byproduct of the mergers and spin-offs is warranty data precisely segmented by industry, without the warranty costs of the former parents' other industrial pursuits muddying the waters.
Of the 26 U.S.-based HVAC manufacturers we identified for this report, nine were active and reporting their warranty costs during 2023. Those companies are: Carrier Global Corp., Trane Technologies plc, Johnson Controls International plc, Emerson Electric Co., A.O. Smith Corp., Lennox International Inc., Rockwell Automation Inc., Standex International Corp., and Tecogen Inc.
For each of the 58 manufacturers, from which we gathered data for every quarter available from 2003 to 2023, we went into their annual reports and quarterly financial statements, and extracted three key warranty metrics: the amount of claims paid, the amount of accruals made, and the amount of reserves held. We also gathered data on each manufacturer's product sales revenue, and used these to calculate two more warranty metrics: claims as a percentage of sales (the claims rate), and accruals as a percentage of sales (the accrual rate).
Warranty Claims Totals
Figure 1 shows the total warranty claims payments of the U.S.-based appliance & HVAC manufacturers, from 2003 to 2023.
Figure 1
HVAC & Appliance Warranties
Claims Paid by U.S.-based Manufacturers
(in US$ millions, 2003-2023)
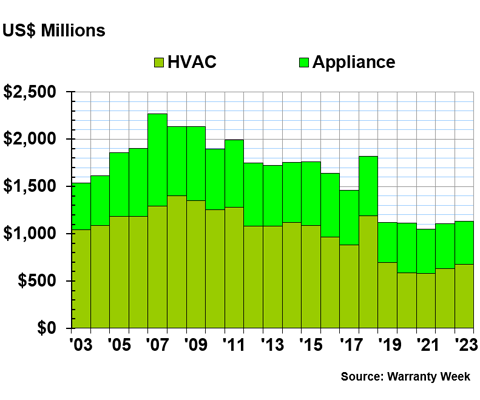
The HVAC & appliance manufacturers spent a collective $1.131 billion on warranty claims during calendar 2023, up 2% from 2022.
Looking at the two categories separately, the HVAC manufacturers spent a total of $675 million on claims during 2023, up 7% from the year prior,, while the appliance manufacturers spent $457 million, down -4%.
Claims costs rose for the majority of the HVAC manufacturers in 2023. Carrier Global Corp. spent $194 million on claims, up 13% from 2022. Trane Technologies plc spent $147 million on claims, up 15%. A.O. Smith Corp. spent $74 million, up 12%. Lennox International Inc. spent $40 million, up 10%. Standex International Corp. spent $1.9 million, up 37%. And Tecogen Inc. spent $282,000, up 20% from the year prior.
A few HVAC manufacturers saw their claims costs fall slightly in 2023. Johnson Controls International plc paid $110 million in warranty claims, down -4% from 2022. Emerson Electric Co. spent $96 million, down -6%. And Rockwell Automation Inc. spent $12 million, down -10%.
On the other hand, the majority of the U.S.-based appliance manufacturers saw their claims costs fall from 2022 to 2023, with a few exceptions. Whirlpool Corp. spent $303 million on claims during 2023, down an ever-so-slight one-third of a percent from 2022. Newell Brands Inc. spent $7 million on claims, down -73% from 2022. John Bean Technologies Corp. spent $11 million, down -7%. Traeger Inc. spent $6 million, down -18%. And National Presto Industries Inc. spent $1.7 million, down -37%.
Middleby Corp. spent $83 million on claims during 2023, up 14% from 2022. Manitowoc Co. Inc., which makes cranes along with commercial refrigeration equipment, spent $31 million on claims, up 12%. And Ametek spent $14 million on warranty claims during 2023, up 20% from 2022.
Warranty Accrual Totals
Figure 2 shows the amounts set aside in accruals by each industry for future warranty costs, from 2003 to 2023.
Figure 2
HVAC & Appliance Warranties
Accruals Made by U.S.-based Manufacturers
(in US$ millions, 2003-2023)
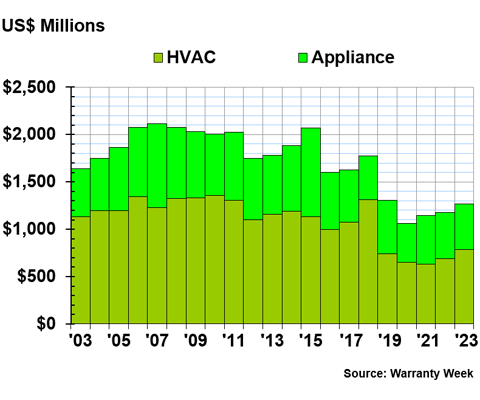
In calendar 2023, the HVAC & appliance industry collectively accrued $1.265 billion for future warranty costs, up 8% from 2022.
Broken down by industry, the HVAC manufacturers spent $787 million, up 14% from 2022, while the appliance manufacturers spent $478 million, down -1%.
Most of the U.S.-based HVAC manufacturers increased their warranty accruals from 2022 to 2023. Carrier Global accrued $237 million during 2023, up 29% from 2022. Trane accrued $187 million, up 19% from the year prior. Johnson Controls accrued $135 million, up 7%. A.O. Smith accrued $80 million, up 24%. Lennox International accrued $54 million, up 7%. Standex International accrued $2.2 million, up 52%. And Tecogen accrued $286,000, up 37%.
Emerson Electric decreased its accruals by -14% in 2023, to $80 million. And Rockwell Automation accrued $12 million, a decrease of -23% from 2022.
Half of the appliance manufacturers increased their accruals, while the other half decreased them. Whirlpool set aside $311 million in accruals during 2023, an increase of 16% from 2022. Middleby accrued $89 million, up 26% from the year prior. Manitowoc accrued $29 million, up 6%. And Ametek accrued $23 million, doubling its accruals from 2022's total of $11 million.
Newell Brands significantly reduced its accruals, from $68 million in 2022, to just $8 million in 2023, a decrease of -88%. John Bean Technologies accrued $10 million, a decrease of -28% from 2022. Traeger accrued $6 million, down -8%. And National Presto Industries accrued $1.5 million, down -49% from the year prior.
Warranty Expense Rates
Figures 3 and 4 show the average quarterly warranty expense rates for each of the two sub-industry groups, from 2003 to 2023. Figure 3 shows the average warranty claims and accrual rates for the U.S.-based HVAC manufacturers.
Figure 3
HVAC Warranties
Average Claims & Accrual Rates
(as a % of product sales, 2003-2023)
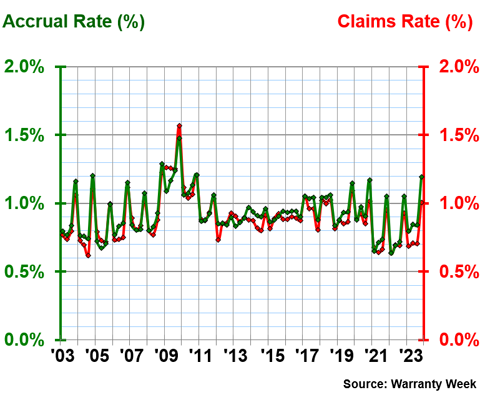
Over 21 years, the U.S.-based HVAC manufacturers had an average claims rate of 0.90%, with a standard deviation of 0.17%, and an average accrual rate of 0.93%, with a standard deviation of 0.16%.
In 2023, the HVAC manufacturers had an average claims rate of 0.78%, and an average accrual rate of 0.92%. The claims rates ranged from 0.68% in the first quarter to 1.01% in the fourth quarter, and the accrual rates ranged from 0.80% in the first quarter to 1.19% in the fourth quarter.
We can see in Figure 3 that the HVAC manufacturers have kept their warranty expense rates firmly between 0.5% and 1.25% over the past two decades, with the exception of the Great Recession in 2009 and 2010. Keep this consistency in mind as we take a look at Figure 4 next.
Figure 4 shows the average warranty expense rates for the U.S.-based appliance manufacturers. Note the different y-axis scales of Figures 3 and 4.
Figure 4
Appliance Warranties
Average Claims & Accrual Rates
(as a % of product sales, 2003-2023)
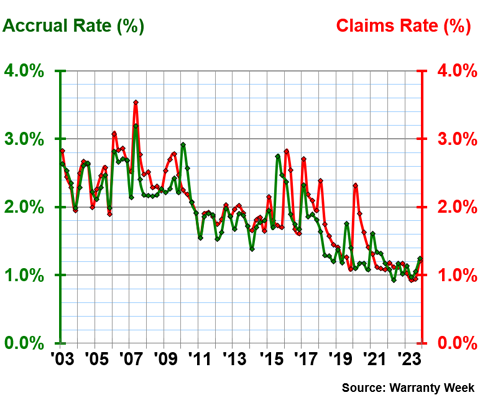
Over 21 years, the U.S.-based appliance manufacturers had an average warranty claims rate of 1.98%, with a standard deviation of 0.57%, and an average accrual rate of 1.89%, with a standard deviation of 0.54%.
These are some of the highest standard deviations we've seen in our data across all of the industries we track, exceeded only by those of the computers and consumer electronics industries. This means there's a high degree of volatility over 21 years in the warranty expense rates of the appliance manufacturers. Indeed, we can see in Figure 4 that the appliance industry's expense rates oscillated between 2% and 3% two decades ago, and in recent years, they've ranged between 1% and 2%.
In 2023, the appliance industry had an average claims rate of 1.03%, and an average accrual rate of 0.92%. The average quarterly claims rates in 2023 ranged from 0.92% in the second quarter to 1.21% in the fourth quarter, and the accrual rates ranged from 0.97% in the second quarter to 1.24% in the fourth quarter.
Warranty Reserve Balances
Our final warranty metric is the year-end balance of each manufacturer's warranty reserve fund. Figure 5 shows the total collective warranty reserves of the U.S.-based HVAC & appliance industries, from 2003 to 2023.
Figure 5
HVAC & Appliance Warranties
Reserves Held by U.S.-based Manufacturers
(in US$ millions, 2003-2023)
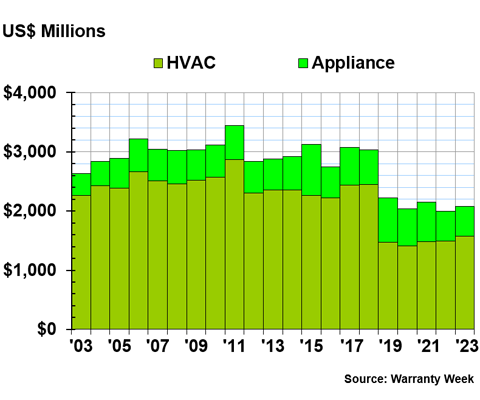
At the end of calendar 2023, the appliance & HVAC industries collectively held $2.075 billion in their warranty reserves, an increase of 4% from the end of 2022.
Broken down by sub-industry, the HVAC manufacturers held $1.576 billion, up 6% from the year prior, while the appliance manufacturers held $498 million, down -2%.
Carrier Global held $568 million in its reserves at the end of 2023, a 3% from the end of 2022. Trane held $374 million, up 16% from the year prior. Johnson Controls held $209 million, up 15%.
The next-largest warranty reserve fund belongs to Whirlpool, which held $206 million at the end of 2023, up 8% from the year prior.
The next two largest warranty reserve funds are also in the HVAC sector. A.O. Smith held $188 million at the end of 2023, up 3% from the year prior. And Lennox International held $143 million, just about the same as the year prior.
Newell Brands held $92 million, down -7% from the end of the year prior. Middleby held $89 million, up 8%.
Emerson Electric held $73 million in reserves at the end of 2023, down -18% from the year prior.
Manitowoc held $57 million, down -2%. And Ametek held $37 million, an increase of 40% from the end of 2022.
Catch up on our series of 21-year charts here:
- Twenty-first Annual Product Warranty Report
- U.S. Small Vehicle Warranty Expenses
- U.S. Truck & Heavy Equipment Warranties
- U.S. Auto Parts & Powertrain Warranties
- U.S. Aerospace Warranties
- U.S. New Home & Building Materials Warranty Report