
U.S. New Home & Building Materials Warranty Report:
The pandemic didn't impact the building trades nearly as much as the housing bubble collapse and subsequent recession did back in 2008. If anything, the pandemic drummed up business for the majority of these manufacturers. The warranty expenses among these building trade industries didn't change much from 2022 to 2023, but their proportion of all U.S. product warranty expenses did, thanks to shrinkage in the high tech sector.
As we observed in our "Twenty-first Annual Product Warranty Report," the proportional dynamics between the warranty expenses of the three key U.S.-based manufacturing sectors have been shifting drastically since the pandemic. In 2020, the vehicle sector accounted for 53% of warranty accruals, the high tech sector accounted for 31%, and the building trades accounted for 16%. In contrast, in 2023, the vehicle sector took on a larger share of all U.S.-based product warranty accruals, 65%, while the high tech sector's share shrunk to 16%, and the building trades' share grew to 19%.
2023 was the first year in which the building trades accounted for a larger share of product warranty expenses than the high tech sector did, largely due to a certain Silicon Valley tech giant ceasing reporting its warranty costs. But even before that departure, these shifts were occurring, as the U.S.-based electronics industry continues to lose share to imports. As such, we're continuing our series of 21-year charts by delving into the growing warranty expenses of the building trades.
This phenomenon has been especially apparent for the new home builders, for whom the pandemic was a boon. We reported on the new home builders' 2023 product warranty expenses earlier this year, in our newsletter "Site-Built New Home Warranty Report," which showed that new home sales are up for almost all, and warranty costs per home sale have increased for some as well. Unlike the vehicle sector, for which the pandemic was a huge blow, the building trades saw the pandemic as a wave that they still seem to be riding.
This week, we're zooming out a bit and looking at the warranty costs of elements that contribute to new homes, including the building itself, the materials used for construction, and the appliances, fixtures, and HVAC systems that are built in. Over the next few weeks, we'll zoom in on the HVAC & appliance industry specifically, as well as power generation, and other industries within the building trades.
We began this report by compiling a list of 237 U.S.-based manufacturers that are engaged in the building trades, and have published warranty expenses in their annual reports or quarterly financial statements sometime since the beginning of 2003. Of them, 82 were active and reporting during 2023.
Of those 237 companies, 59 are builders of new homes; 120 are suppliers of building materials, fixtures or furniture; and 58 manufacture household or foodservice appliances and/or commercial and residential heating, ventilation and air conditioning (HVAC) systems.
The largest U.S.-based new home builders that report their warranty expenses include: Lennar Corp., PulteGroup Inc., D.R. Horton Inc., NVR Inc., and Toll Brothers Inc.
The largest building materials manufacturers include: Stanley Black & Decker Inc., Pentair plc, Mohawk Industries Inc., Acuity Brands Inc., Cornerstone Building Brands Inc., Masco Corp., PGT Innovations Inc., Sherwin Williams Co., RPM International Inc., La-Z-Boy Inc., and American Woodmark Corp.
And the largest manufacturers in the appliance & HVAC category include: Whirlpool Corp., Carrier Global Corp., Trane Technologies plc, Johnson Controls International plc, Emerson Electric Co., Middleby Corp., and A.O. Smith Corp.
From each company's financial reports, we extracted three key warranty metrics: the amount of claims paid, the amount of accruals made, and the amount of reserves held at the end of the calendar year. We also collected data on each manufacturer's product revenue, excluding revenue from anything that doesn't carry a product warranty, such as extended service contracts. With these data, we calculated two additional warranty metrics: claims as a percent of sales (the claims rate), and accruals as a percent of sales (the accrual rate).
Warranty Claims Totals
Figure 1 shows the total product warranty claims paid by these three industries in the building trades, from 2003 to 2023. We can see that claims costs are on the rise in these industries, although not to the heights of the housing bubble before the 2008 recession.
Figure 1
Homebuilding & Materials Warranties
Claims Paid by U.S.-based Manufacturers
(in US$ millions, 2003-2023)
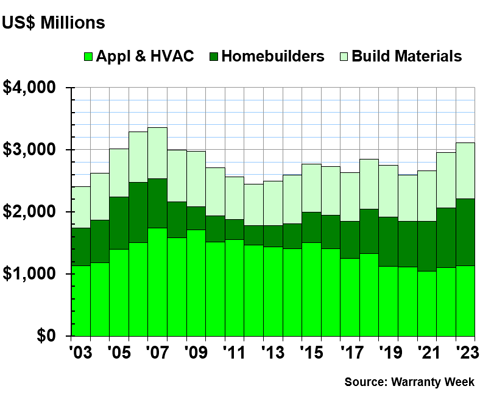
In 2023, the appliance & HVAC industry spent $1.131 billion on warranty claims, up 2% from 2022; the new home builders spent $1.083 billion, up 13%; and the building materials manufacturers spent $896 million, up just 0.5%.
Among the three industries, Whirlpool spent the most on warranty claims, $303 million. This spending was right on par with the appliance manufacturer's 2022 warranty claims costs; technically, 2023 saw a drop of one-third of a percent.
Homebuilder Lennar Corp. had the next-highest claims costs of $290 million during 2023, up 11% from the year prior.
HVAC manufacturer Carrier Global Corp., formerly part of United Technologies until its merger with Raytheon in 2020, spent $194 million on warranty claims in 2023, up 13% from 2022. Elevator manufacturer Otis Worldwide Corp., the other spin-off resulting from the United Technologies-Raytheon merger, spent $6 million on claims in 2023, down -25% from the year prior.
Trane Technologies, formerly Ingersoll-Rand until its 2020 merger with Gardner Denver, and subsequent spin-off of the HVAC business as Trane, spent $147 million on claims during 2023, up 15% from 2022.
Johnson Controls International plc spent $110 million on claims in 2023, down -4% from 2022. Emerson Electric Co. spent $96 million, down -6%. Middleby Corp. spent $83 million, up 14%. And A.O. Smith spent $74 million, up 12%.
Among the homebuilders, D.R. Horton Inc. spent $127 million, up 2% from 2022. PulteGroup Inc. spent $100 million on claims, up 10%. NVR Inc. spent $93 million, up 6%. Taylor Morrison Home Corp. spent $81 million, up 5%. And Toll Brothers Inc. spent $75 million, up 19%.
Among the building materials manufacturers, Stanley Black & Decker Inc. spent the most on warranty claims, $161 million, down -1% from the year prior. Pentair plc spent $88 million, up 25%. Mohawk Industries spent $58 million, the same as it did in 2022.
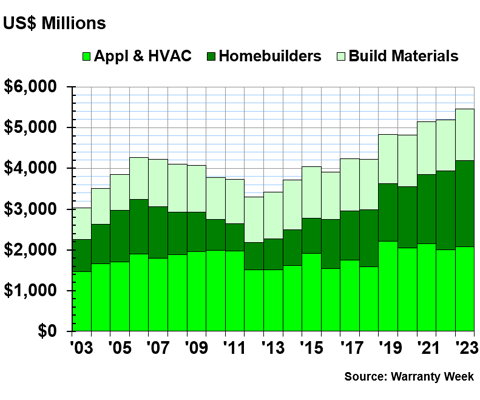
Warranty Accrual Totals
Figure 2 shows the total amounts these three industries in the building trades set aside in warranty accruals annually, from 2003 to 2023.
Figure 2
Homebuilding & Materials Warranties
Accruals Made by U.S.-based Manufacturers
(in US$ millions, 2003-2023)
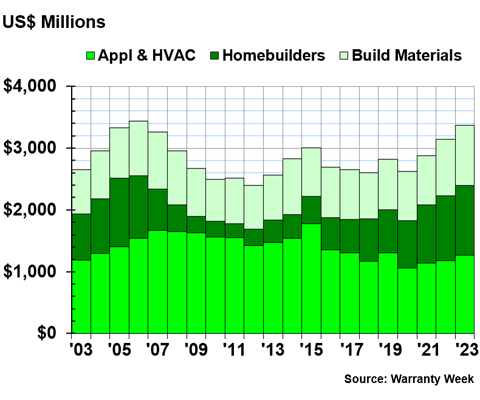
In 2023, the appliance & HVAC industry accrued $1.265 billion for future warranty expenses, up 8% from 2022. The homebuilders accrued $1.129 billion, up 7%. And the building materials manufacturers accrued $978 million, up 8%.
Once again, Whirlpool led the pack, having accrued $311 million during 2023, up 16% from 2022. Carrier Global accrued $237 million, up 29% from the year prior. Trane also increased its accruals considerably, setting aside $187 million, up 19% from 2022.
Johnson Controls accrued $135 million, up 7% from the year prior. Middleby Corp. accrued $89 million, up 26%. A.O. Smith accrued $80 million, up 26%, and Emerson Electric Co. also accrued $80 million, a -14% drop from the year prior. Lennox International Inc. accrued $54 million, up 7%.
Among the homebuilders, Lennar accrued $286 million, up 4% from 2022. D.R. Horton accrued $196 million, up 5%. PulteGroup accrued $108 million, up 26%. NVR accrued $95 million, down just -1%. Taylor Morrison accrued $83 million, up 9%.
Trailer home manufacturer Cavco Industries Inc. accrued $87 million during 2023, up a steep 63% from 2022. And mobile home and park model RV manufacturer Skyline Champion Corp. accrued $59 million, up 9%.
In the building materials industry, Stanley Black & Decker accrued $171 million, up 10% from 2022. Pentair accrued $90 million, up 6%. Masco Corp. accrued $64 million, up a sharp 60%. Mohawk Industries accrued $57 million, up 12%. Acuity Brands accrued $56 million, up 8%.
Along with Masco, a few other building materials manufacturers made big changes in the amount they accrued in 2023, compared to 2022. Arhaus Inc. doubled its accruals from $12 million in 2022 to $24 million in 2023. Otis Worldwide more than doubled its accruals, from $2 million in 2022 to $5 million in 2023. AAON Inc. almost doubled its accruals, from $9 million in 2022 to $16 million in 2023. And Trex Company Inc. also doubled its accruals, from $3.6 million in 2022 to $7.3 million in 2023.
There were also a few big downward shifts in accruals among the building materials manufacturers. MKS Instruments Inc. accrued $11 million in 2023, down -65% from 2022's $31 million. Hubbell Inc. accrued $11 million, down -38% from 2022's $17 million. And American Woodmark accrued $26 million, down -27% from 2022's total of $36 million.
Warranty Expense Rates
Figures 3-5 show the average warranty claims and accrual rates for each industry group in this report. We'll break down the dichotomy between HVAC and appliance in our next newsletter, but are presenting the two together in Figure 5, just as they are presented together in Figures 1, 2, and 6.
Homebuilder Warranty Expense Rates
Figure 3 shows the average warranty expense rates of the new home builders from 2003 to 2023.
Figure 3
New Home Warranties
Average Warranty Claims & Accrual Rates
(as a % of product sales, 2003-2023)
Over 21 years, the new home builders had an average claims rate of 0.95%, with a standard deviation of 0.30%, and an average accrual rate of 0.84%, with a standard deviation of 0.13%.
As we can see plainly in Figure 3, these figures reveal that the claims rates have been much more volatile in this industry than the accrual rates have. When the housing bubble popped and the recession hit in 2008, the homebuilders decreased accruals as their revenues decreased, but they had to continue paying claims on the homes they had already sold, driving the claims rates way up for a few years.
In 2023, the homebuilders had an average claims rate of 0.74%, and an average accrual rate of 0.76%. The claims rates ranged from 0.90% in the first quarter to 0.60% in the third quarter, while the accrual rates ranged from 0.71% in the third quarter to 0.87% in the first quarter.
Building Material Warranty Expense Rates
Figure 4 shows the average warranty expense rates of the building materials manufacturers, from 2003 to 2023.
Figure 4
Building Material Warranties
Average Warranty Claims & Accrual Rates
(as a % of product sales, 2003-2023)
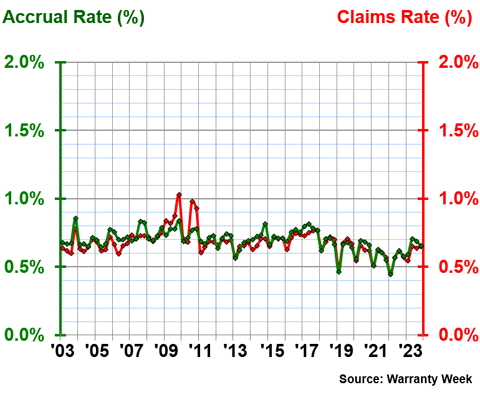
Over 21 years, the building materials manufacturers had an average claims rate of 0.68%, with a standard deviation of 0.09%, and an average accrual rate of 0.69%, with a standard deviation of 0.08%.
As we can see in Figure 4, and as these numbers indicate, the warranty expense rates in the building materials industry are much less volatile than they are in the homebuilder industry. The claims and accrual rates tend to stay close to each other in this industry.
In 2023, the building materials manufacturers had an average claims rate of 0.62%, and an average accrual rate of 0.66%. The claims rates ranged from 0.55% in the first quarter to 0.65% in the second and fourth quarters. The accrual rates ranged from 0.59% in the first quarter to 0.71% in the second quarter.
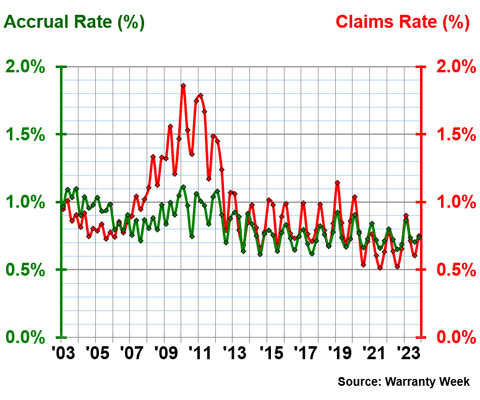
Appliance & HVAC Warranty Expense Rates
Figure 5 shows the average warranty expense rates among the appliance & HVAC industries, from 2003 to 2023.
Figure 5
Appliance & HVAC Warranties
Average Warranty Claims & Accrual Rates
(as a % of product sales, 2003-2023)
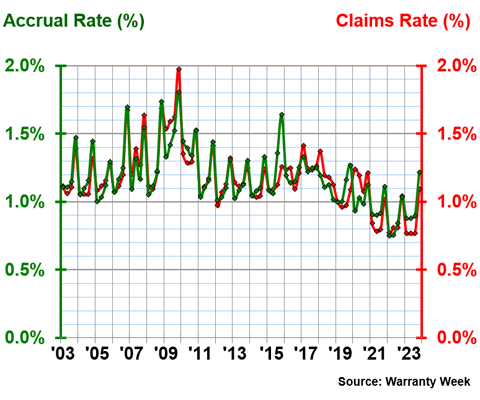
Over 21 years, the appliance & HVAC manufacturers had an average claims rate of 1.17%, with a standard deviation of 0.22%, and an average accrual rate of 1.17%, with a standard deviation of 0.21%.
In 2023, the appliance & HVAC industry had an average claims rate of 0.85%, and an average accrual rate of 0.97%. The claims rates ranged from 0.77% in the first, second, and third quarters, to 1.09% in the fourth quarter. The accrual rates ranged from 0.88% in the first and second quarters, to 1.21% in the fourth quarter.
Like the homebuilders, the appliance & HVAC manufacturers see seasonal fluctuations in their warranty expense rates, a phenomenon we don't see among the building materials manufacturers.
Warranty Reserve Balances
Our final warranty metric is the end-balance of each manufacturer's warranty reserve fund on the last day of each calendar year, from 2003 to 2023.
Figure 6
Homebuilding & Materials Warranties
Reserves Held by U.S.-based Manufacturers
(in US$ millions, 2003-2023)
At the end of 2023, the appliance & HVAC manufacturers collectively held $2.075 billion in their warranty reserve funds, up 4% from 2022. The homebuilders held $2.110 billion, up 8% from 2022. And the building materials manufacturers held $1.280 billion, up 3%.
Carrier Global held the largest reserve fund among the three building trade industries at the end of 2023, with $568 million, a 3% increase from 2022.
The next-largest reserve fund belongs to D.R. Horton, with $532 million, a 15% increase from 2022. Next is Lennar with $415 million, a decrease of -1% from the year prior, followed by Trane with $374 million, a 16% increase from 2022.
Also among the appliance & HVAC manufacturers, Whirlpool had $206 million sitting in it warranty reserves at the end of 2023, an 8% increase from the year prior. Johnson Controls held $209 million, a 15% increase from the year prior. A.O. Smith held $188 million, up 3%. And Lennox International held $143 million, the same balance it held at the end of 2022.
Joining D.R. Horton and Lennar in the homebuilders category, Toll Brothers held $206 million in reserves at the end of 2023, a 25% increase from the year prior. Taylor Morrison held $184 million, up 14%. NVR held $146 million, up 2%. PulteGroup held $120 million, up 11%. Hovnanian held $99 million, up 1%. And KB Home held $98 million, a decrease of -4% from the year prior.
Most of the manufacturers of building materials don't bother to hold warranty reserve funds as large as those of many in the homebuilding or appliance & HVAC industries. The largest reserve fund among the building materials manufacturers belongs to Cornerstone Building Brands Inc., with $194 million, a -4% decrease from the end of 2022. Next is Owens Corning, with $97 million in reserves, a 10% increase from the year prior. Masco Corp. held $83 million at the end of 2023, a 4% increase from the year prior.
Herman Miller Inc. held $71 million, down -4% from the year prior. Pentair held $65 million, up 3%. And V.F. Corp. held $52 million in reserves at the end of 2023, down -2% from the end of 2022.
Catch up on our series of 21-year charts here:
- Twenty-first Annual Product Warranty Report
- U.S. Small Vehicle Warranty Expenses
- U.S. Truck & Heavy Equipment Warranties
- U.S. Auto Parts & Powertrain Warranties
- U.S. Aerospace Warranties