


U.S. & German Auto Warranties:
Car manufacturers based in Germany have the highest warranty expense rates in the industry. But that doesn't mean they make the worst cars and more than it suggests that China, the country with the lowest warranty expense rates, makes the best cars. Somewhere in the middle are the U.S. and Japan.
The great car countries of the world are Germany, Japan, the U.S., and more recently, China. Together, we estimate, manufacturers based in these four countries pay 80% of the world's automotive warranty claims and hold 82% of its automotive warranty reserves.
In previous weeks we detailed the warranty expense estimates of all the automotive OEMs based in Japan and China. This week, we plan to look at the half-dozen major automakers based in Germany and the U.S.
International Trade
Of course, with companies such as BMW manufacturing SUVs in South Carolina and exporting some of them to other countries, it's becoming impossible to assign a single nationality to a car. Volkswagen and Mercedes-Benz also manufacture cars in the U.S., and although GM recently sold its Opel operations to a French company, Ford-Werke GmbH continues to manufacture vehicles in Cologne, Germany.
Suffice it to say that there is lots of history between the car companies of the U.S. and Germany, as there is between them and the automakers in Japan and China as well. And if you go down to a parts and components level, cars have become even more international in recent years, with many parts coming from American-owned factories in Mexico and Canada, not to mention Europe and Asia. Sometimes all the pieces of entire vehicles are exported and assembled abroad. So it's not so easy to say any more what country a car comes from.
But what we're doing is assigning a nationality to a company based solely on the location of its headquarters, not where it makes or sells its cars. It doesn't matter if BMW makes SUVs in the U.S. and exports them to Germany. The company is ultimately based in Germany and reports its worldwide warranty expenses from there, even if they arise from vehicles manufactured elsewhere.
Much of the data that follows has been detailed in previous newsletters, so we won't need to explain it in great detail again. However, in the following few charts, we've elected to include some available data for Fiat Chrysler Automobiles US LLC, even though it's technically a subsidiary of an Italian automobile manufacturer registered in the Netherlands with headquarters in the UK. But we're not including Renault or PSA in the German charts, even though Renault makes engines for Daimler and PSA now owns Opel. Again, it's where the headquarters is located, not where the cars are made or sold.
U.S. Claims
In Figure 1, the Chrysler warranty data appears in 2009 then disappears in 2014. Actually, it was only made public because FCA US sold some bonds that required it to file U.S. financial statements after Chrysler went bankrupt and was acquired by Fiat. When those bonds were redeemed, the U.S. filings ceased. Meanwhile, in 2008, Chrysler was still privately-owned, so it filed no financial statements at all, and there is no warranty data. From 2015 to 2017, only the parent company filed any warranty expense reports.
The biggest surprise in the Figure 1 data is that in 2017, for the first time, Ford's annual claims total exceeded GM's. The other notable aspect of Figure 1 is how the tiny sliver that is Tesla is finally becoming visible. The company paid $122.5 million in claims last year, against the $3.13 billion paid by GM and the $3.46 billion paid by Ford. If this were a pie chart, Tesla's share of the U.S. claims payments pie would now be approaching two percent. Ford's was 51.5% while GM's was 46.6%.
Figure 1
American Automakers
Claims Paid by Manufacturers
(in US$ millions, 2008-2017)
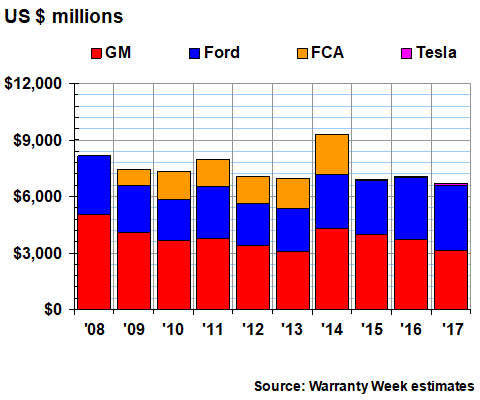
The spike in 2014 was of course linked to the cost of GM's ignition key recalls. But both FCA and Ford also had bad years in 2014. Meanwhile, GM's claims costs have declined four years in a row. And Ford and GM's combined total in 2017 was the lowest it's been since 2013.
Warranty Accruals
The ignition key-related costs show up even more dramatically in the 2014 accrual data in Figure 2, when GM's total warranty accruals spiked to $5.45 billion. Once again, we've included the available data for FCA US for the years 2009-2014. But Tesla's accrual data has been visible for at least four years, because the company has always set aside far more than it actually spends on claims. In 2017, Tesla's share of the $5.31 billion accrual total approached 5%, while GM's was 52.8% and Ford's was 42.6%.
Figure 2
American Automakers
Accruals Made by Car Manufacturers
(in US$ millions, 2008-2017)
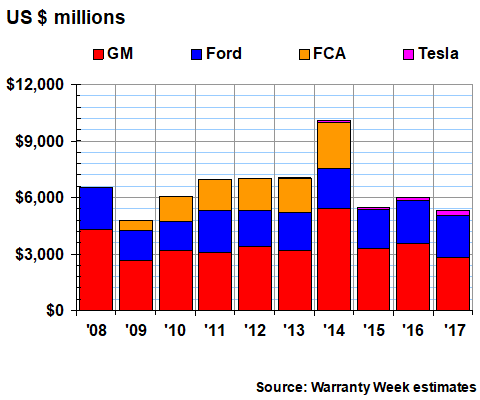
Once again, in 2017, GM's and Ford's combined totals for the accrual metric were the lowest they've been in multiple years. But while claims were at their lowest level since 2013, these two companies haven't made less accruals than they did in 2017 since 2010, when their worldwide sales were much lower. In other words, their combined accrual rate must also be down.
Warranty Reserves
U.S.-based automakers ended 2017 with a reported $14.03 billion in their warranty reserve funds, about 2.1 times as much as they paid in claims that year. That ratio between reserves and claims has generally been lower than 2.1 over the past decade, though it was slightly higher than that level in both 2013 and 2016. The long-term average ratio between reserves and claims has been 1.9. In other words, the reserve funds are proportionally larger now than they have been.
In Figure 3 it is clear that the combined reserve levels of GM and Ford have been higher in the past four years than they were in the previous six. Ford's balance, in fact, was higher at December 31, 2017 than it's ever been. GM's balance peaked at $9.7 billion at the end of 2016.
Figure 3
American Automakers
Reserves Held by Car Manufacturers
(in US$ millions, 2008-2017)
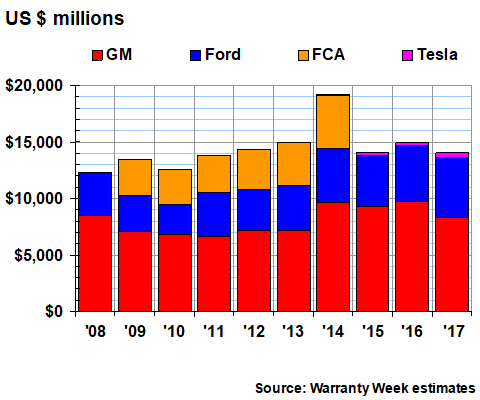
As with its accruals, Tesla's reserve data has been visible in these charts for the past several years. But there's Tesla data in there going back to 2009. In 2017, its share of the U.S. pie stood at 3%, to GM's 59% and Ford's 38%.
FCA US, since it's no longer reporting separately from its Italian/Dutch/British parent, is no longer counted in the U.S. charts. We could have instead chosen to create ongoing estimates for Chrysler, as we did with the Chinese and Japanese automakers that do not report their warranty expenses. But since the parent already includes Chrysler's expenses in its company-wide reports, that was unnecessary.
Warranty Expense Rates
In Figure 4, we're taking the claims and accrual totals from Figures 1 and 2 and dividing it by the corresponding worldwide sales totals. Notice that the average claims and accrual rates of the U.S.-based manufacturers has remained relatively stable for the past three years, at levels of about 2.3% and 1.9%, respectively.
Figure 4
American Automakers
Average Warranty Claims & Accrual Rates
(as a % of product sales, 2008-2017)
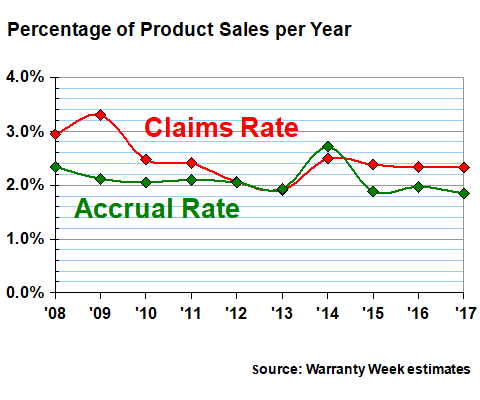
Once again, because of the ignition key recalls, 2014 remains the recent peak for both warranty expense rates. The U.S.-based industry's average claims rate hit 2.5%, and its accrual rate exceeded 2.7%. Claims rates were higher in the recessionary years of both 2008 and 2009, when sales were down, but accrual rates hit their peak level of the decade at that time.
German Automotive Warranties
Normally, when we report on Daimler, BMW, and Volkswagen automakers, we also include the French and Italian companies in a Europe-wide round-up. This is the first time we'll look at Germany-only data, though the warranty expenses of Daimler, BMW, and Volkswagen have always dominated the European totals.
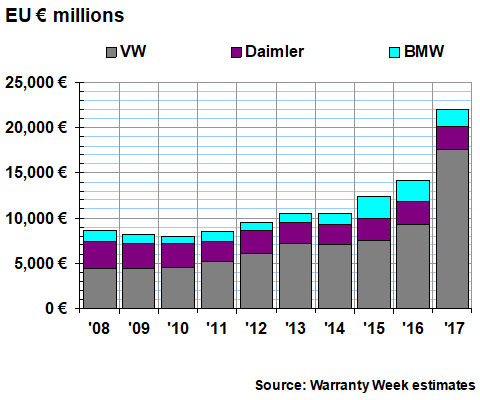
We have previously remarked about the fact that VW is the world's largest warranty provider by a large margin, based upon the amount of claims paid. With an exchange rate of US$1.13 to the euro in 2017, VW's claims cost topped US$19.8 billion last year, more than three times as much as GM and Ford combined. VW now accounts for almost 80% of the German claims total, up from just over half in 2008. The reason, of course, is the fallout from the diesel engine emissions testing scandal, and the recalls and buybacks that followed.
Figure 5
German Automakers
Claims Paid by Manufacturers
(in millions of euro, 2008-2017)
Claims lag behind accruals, or more properly, first a company predicts the expense and makes the accrual, and then years later the claims are actually paid. In Figure 6, it's apparent that VW's accruals first spiked in 2015, which is appropriate given that the news of the scandal first broke that summer. As Figure 5 shows, however, the spike in actual claims came two years later.
Figure 6
German Automakers
Accruals Made by Car Manufacturers
(in millions of euro, 2008-2017)
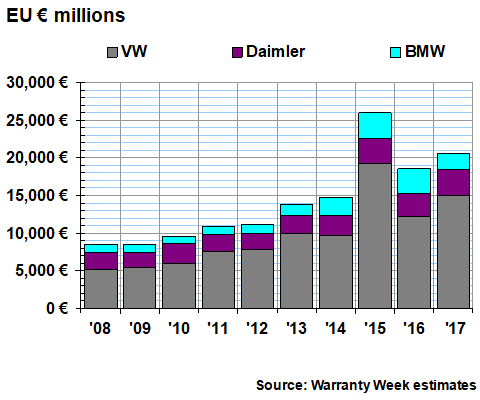
As bad as things look for VW, however, notice also that BMW has also seen its claims and accruals reach a high level in the last few years. Both its claims and accrual levels peaked in 2015, though they remained high in both 2016 and 2017. And according to recent press reports, its warranty woes have apparently extended into 2018. Meanwhile, Daimler's claims were at a high point at the beginning of the decade, while accruals were at a high point at the end of it.
Warranty Reserves
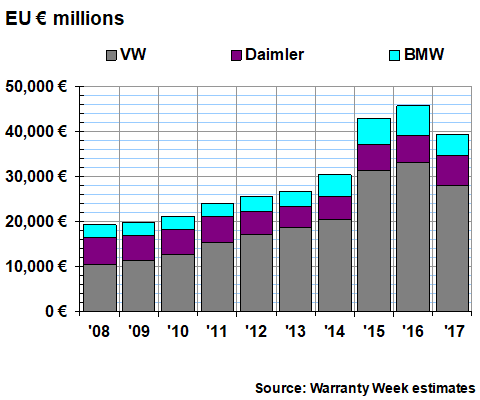
In Figure 7, we're looking at the warranty reserve balances of the three companies from 2008 to 2017. Once again, the rising VW total drove up the industry-wide total for this metric to new heights. But again, because accruals precede claims, the peak in reserves came at the end of 2016. VW reported a reserve fund balance of more than 33 billion euro (US$36.56 billion) at the end of that year, more than GM, Ford, Daimler, and BMW combined.
Figure 7
German Automakers
Reserves Held by Car Manufacturers
(in millions of euro, 2008-2017)
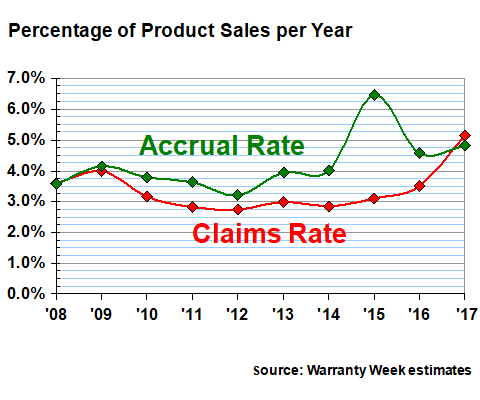
In Figure 8, we're looking at the average claims and accrual rates of the three Germany-based automakers. And it should come as no shock that their accrual rate peaked at 6.5% in 2015 while their claims rate hit a new high of 5.1% in 2017. Of course, it has everything to do with VW, as the shape of the metrics in Figures 5 and 6 strongly foreshadow.
Figure 8
German Automakers
Average Warranty Claims & Accrual Rates
(as a % of product sales, 2008-2017)
Now that those U.S. and German statistics are out in the open, the inevitable question is how do they stack up worldwide? With the Chinese data in last week's newsletter and the Japanese market estimates two weeks ago, we now have some form of warranty expense data for all four of the top home bases for the world's major automakers. All that's missing are Hyundai and Kia, Renault and PSA, Tata and Mahindra, Fiat, Volvo Cars, and a few smaller companies based in eastern Europe and southwestern Asia.
Looking at just the top four countries, however, and looking at just their average claims rates, what's remarkable is how they relate to each other. China is always the lowest, followed by Japan, then the U.S., and then Germany is always at the top. In fact, the lines never cross. For at least ten years, the warranties of cars made by German companies have been the most expensive among the world's four top automotive countries. That pattern pre-dates even the diesel engine scandal.
As we've said in the past, this does not necessarily correlate to product quality or reliability. Chinese cars are not the world's best, nor are German cars the world's worst. Instead, their relative warranty expense rates probably has more to do with each country's accounting rules, labor costs, consumer protection laws, and tax rates. In other words, German car parts are always expensive, no matter where in the world they're needed. Chinese claims costs are always low, even for their joint ventures with German companies.


