Toyota's Warranties & Recalls:
For the first time ever, the automaker's worldwide recall costs have exceeded its warranty costs. And that has changed both what Toyota reports and how it gets reported in the company's financial statements.
There's no doubt that Toyota Motor Corp. has stumbled badly in recent years. Sales are down, costs are up, and the company's quality image has been badly damaged.
The March 11 earthquake caused factory shut-downs in Japan and parts shortages worldwide. But long before that terrible event, a spike in safety recalls was causing Toyota's cost of quality to soar.
Since 2009, Toyota has had to deal with the media-driven hysteria over accidents allegedly caused by unintended acceleration. Initially, the company was criticized for a slow response to a major problem. But even though industry experts failed to identify the cause of the problem -- and if there really was a problem -- the recall costs still rose.
In November 2009, Toyota recalled 3.8 million vehicles in the U.S. to fix the floor mats. In January 2010 that recall was widened to include faulty accelerator pedals, and to also cover both Europe and China. In February, a separate recall was announced to cover the brakes in the Prius and Camry models.
And those recalls continued into 2011, where they continued to drive Toyota's costs up. Just this week, the company announced plans to recall 45,500 Highlander Hybrid and 36,700 Lexus Rx 400h hybrid SUVs made in 2006 and 2007 because of faulty computer boards.
Recalls Exceed Warranty Costs
None of this has a direct bearing on Toyota's warranty costs, because the company has always counted recalls and warranty separately. That's not a problem when recall costs are modest. But that's the problem: They're no longer modest. In the fiscal year ended March 31, 2011, for the first time ever, Toyota spent more money worldwide on recalls than it did on warranty.
As the U.S. slips into its Fourth of July holiday mode, and Canadian readers begin their own long weekend, we were planning to provide a roundup of warranty expenses for some top European and Asian manufacturing companies. But then we realized there was more than enough news in just the Toyota numbers. So we'll bring you the international warranty figures next week. This week, it's all about Toyota.
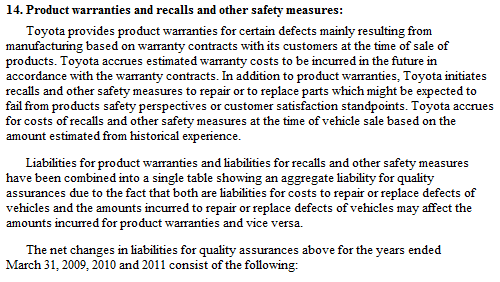
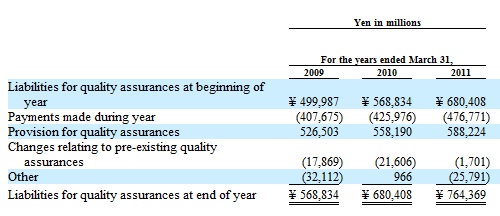
We start with Toyota's annual report, filed with the U.S. Securities and Exchange Commission last Friday. In the notes to the consolidated financial statements, we ran across the following entry:
Figure 1
Toyota's Warranty & Recall Costs
Source: Toyota Motor Corp.
As the note explains, "Liabilities for product warranties and liabilities for recalls and other safety measures have been combined into a single table."
The problem is, the historical data going back to fiscal 2003 was for product warranties only. For the eight years through fiscal 2010, Toyota always detailed its product warranty expenses in its annual reports. Recall costs were always separate and were never detailed, presumably because they were never that substantial.
However, in the most recent fiscal year, the company reversed course. Now, Toyota details its recall costs both separately and combined with warranty. But it no longer details warranty separately.
New Chart for Recall Costs
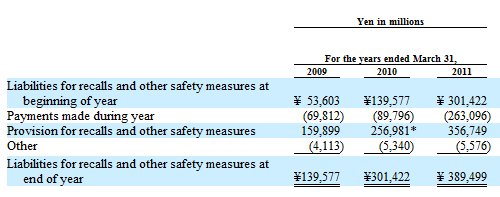
Fortunately, the company also included the following table for recalls. Previous to this year, a table for recall expenses had not been included in Toyota's annual reports.
Figure 2
Toyota's Recall Costs


Source: Toyota Motor Corp.
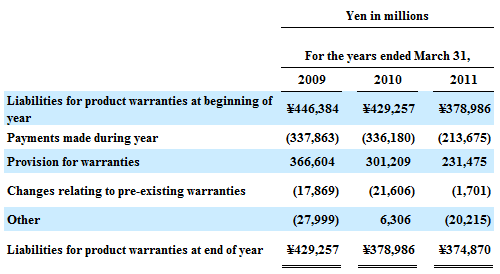
It's a simple mathematical exercise to take the data in Figure 2 and subtract it from the data in Figure 1. This leaves us with a table of data for Toyota's product warranty expenses alone, which can be found in Figure 3.
Creating Estimates
We should note that while Figures 1 & 2 are taken straight out of Toyota's annual report, the table in Figure 3 is created by the Warranty Week art department, mimicking the style Toyota used in its annual report. So while we believe the data in Figure 3 to be accurate, it is not from an official source.
Figure 3
Toyota's Warranty Costs
Source: Warranty Week
The big news here is Toyota's decision to begin reporting warranty and recall together, and to cease reporting warranty separately. It's as if warranty has been downgraded to a secondary status, while recalls take over the leading role. Then again, Toyota is now taking a more realistic and accurate look at its total cost of quality, rather than separating the warranty and recall components of that cost.
Other Automakers
Some automakers count recall costs and warranty costs together. Others keep them separate. There is no requirement that they be counted either together or separately. FASB Interpretation Number 45 simply requires that the warranty table, as seen in Figure 3, be included in all annual and interim financial statements.
General Motors Co. is one of the companies that always bundles warranty and recall expenses together. In its latest annual report, General Motors states that its FIN 45 warranty table "summarizes activity for policy, product warranty, recall campaigns and certified used vehicle warranty liabilities."
Ford Motor Co., on the other hand, speaks of warranty and recall expenses as separate items. In Ford's latest annual report, the final sentence of this paragraph spells out the policy to count product recalls separately from warranty:
"Warranty Coverage and Additional Service Actions. We currently provide warranties on vehicles we sell. Warranties are offered for specific periods of time and/or mileage, and vary depending upon the type of product, usage of the product and the geographic location of its sale. In compliance with regulatory requirements, we also provide emissions-defects and emissions-performance warranty coverage. Pursuant to these warranties, Ford will repair, replace, or adjust all parts on a vehicle that are defective in factory-supplied materials or workmanship during the specified warranty period. In addition to the costs associated with the warranty coverage provided on our vehicles, we also incur costs as a result of additional service actions not covered by our warranties, including product recalls and customer satisfaction actions."
As long as recall costs are minimal, this has only a minor effect on warranty claims and accrual rates. For instance, in Toyota's fiscal year ending on March 31, 2009, its warranty claims payments were almost five times larger than its recall payments. Combining warranty and recall payments would have driven the claims rate up from 1.8% to 2.2%.
Total Cost of Quality
But what if recall payments grow and eventually exceed warranty payments? In such a case, leaving them out would present a warped picture of what Toyota calls its expenses for "quality assurances." So that's what we need to do: detail Toyota's warranty and recall expenses, both together and separately.
We don't know Toyota's recall expenses in the fiscal years 2003 to 2008. But we do know the company's warranty-only expenses for the fiscal years 2003 to 2010, and its recall-only expenses from the fiscal years 2009 to 2011. And in Figure 3, we derived figures for Toyota's warranty-only expenses in the most recent fiscal year.
With this data in hand, we're going to chart Toyota's warranty claims payments and recall payments together in Figure 4, and warranty accrual and recall provisions together in Figure 5. Note that all these figures are in billions of yen per year (at today's rates, US$1.00 = ¥80.49, so a billion yen is close to $12.4 million).
Figure 4
Toyota Motor Corp.
Warranty Claims & Recall Payments, 2003-2011
(in billions of yen per fiscal year)

Note in Figure 4 that the recall payments in fiscal 2009 and even into fiscal 2010 weren't all that large, compared to warranty claims payments in those years. It wasn't until the most recent fiscal year that recall costs overwhelmed product warranty costs.
In terms of a percentage of revenue, warranty consumed 1.2% in the most recent fiscal year while recalls consumed a much greater 1.5%. Back in fiscal 2009 Toyota's warranty claims rate was 1.8% while its recall payments were equal to about 0.4% of product revenue. So in the past two years, by our estimates, Toyota's warranty costs fell by about a third while its recall costs quadrupled.
Accruals Equal Provisions
The flip side of warranty claims would be warranty accruals. The opposite of recall payments would be recall provisions. Back at the end of fiscal 2010, Toyota changed from a pay-as-you-go system for its recall costs to an accrual method that mirrored its warranty accounting. And then in fiscal 2011 it began to count the two together. There are slight differences in the terminology (compare Figures 2 & 3) but basically, a recall provision is the amount set aside at the time of sale to pay for anticipated future recall costs.
In Figure 5, we see a similar pattern as in Figure 4. Recall provisions start small but soon they overwhelm warranty accruals. The difference here is how fast it happens. It's a 30/70 ratio in fiscal 2009; 45/55 in fiscal 2010, and 60/40 in fiscal 2011.
Figure 5
Toyota Motor Corp.
Warranty Accrual & Recall Provisions, 2003-2011
(in billions of yen per fiscal year)

And that's the big news here: at Toyota, recall costs have now overwhelmed warranty costs. Not only are recall costs now counted as part of the cost of quality -- now they're more than half the total.
Revenue hasn't changed, so it's still the same procedure to calculate the total cost of quality as a percentage of sales as to count just the cost of warranty alone. In fiscal 2009 we have product sales of ¥18,565 billion. In fiscal 2010 we have product sales of ¥17,197 billion. And in fiscal 2011, we have product sales of ¥17,337 billion. Take the annual figures for warranty and recall from Figures 4 & 5 and you have claims and accrual rates with and without recall costs included.
Claims and Accrual Rates
In Figure 6 below, the red and green lines represent the cost of warranty alone, while the orange and lime green lines represent the total cost of warranty and recalls taken together. In keeping with the format used for other companies, the data in Figure 6 represents a time series of 33 quarters, from the first quarter of calendar 2003 to the first quarter of calendar 2011.
Figure 6
Toyota Motor Corp.
Warranty Claims & Accrual Rates
With & Without Recall Expenses, 2003-2011
(as a percentage of product revenue per fiscal year)

The surprise here is how much of Toyota's revenue went towards warranty and recall costs last year. The lime green line, representing the amounts set aside for both recalls and warranty, climbed to 3.4% last year. Warranty alone was only 1.3% of that, meaning that recall costs exceeded two percent of product revenue in the fiscal year ended March 31, 2011. That represents a more than doubling of the recall provision rate in the past two years, versus a one-third decline in the accrual rate.
Comparing Apples and Oranges
It's dangerous to compare automakers precisely because of differences like these in what they do and don't include as a warranty expense. But let's make two quick comparisons. Honda Motor Co., which has historically always had warranty-only costs close to Toyota's, just turned in an annual report with claims and accrual rates both below one percent of product revenue. GM, which has always counted warranty and recalls together, just turned in a first-quarter report detailing a two percent accrual rate and a 2.6% claims rate.
We'll detail the expenses of the other automakers next week. But first we need to ask readers a question: Which set of figures should we use for Toyota from now on?
On the one hand, Toyota has chosen to emphasize the combined warranty-and-recall figures and omit the warranty-only figures. Should we follow suit? That would result in combined costs similar to GM's.
But on the other hand, warranty and recall are still separate items. Should we try to keep them separate as well? That would keep Toyota's warranty-only costs closer to Honda's.


