Warranty in Financial Statements:
Because warranty disclosures began appearing in annual reports less than seven years ago, it takes a bit of skill to hunt down the right data and turn it into meaningful percentages and ratios. So until the procedures are old enough to make it into the accounting textbooks, here's a step-by-step guide to how it's done, using one company's most recent disclosures as an example.
Every few months, as manufacturers and retailers declare their revenue and earnings, am array of ratios and percentages get thrown around in the financial press. Price/earnings multiples are updated, and dividend payout ratios are recalculated. Just this week, several major warranty providers' stock prices have soared as their earnings per share figures exceeded expectations.
In the last few years, warranty measurements have also been thrown into the mix, based on their potential to serve as a leading indicator of product quality. And every time Warranty Week posts a graph that details a given company's warranty expenses, a reader always asks how we did the calculations. Half seem to doubt the figures could be correct, while half seem to want to repeat the process themselves or at least be able to explain how it's done to upper management.
And we never had an article to which to point them, that explains how it's done. So all you financial wizards, warranty experts and mathematical prodigies, please take the rest of the week off, while we present a tutorial on how to extract warranty data from financial statements and turn it into more meaningful metrics. The warranty data has been in the public domain for years. After this week's newsletter, so will a description of how it can be processed.
In this article, we're spotlighting data storage company Quantum Corp. for two reasons. First, its fiscal year ends on March 31, and therefore the company's annual report was published just a few weeks ago. Second, Quantum is one of the few companies that mentions warranty in both the balance sheet and the cash flow statement, along with the inclusion of a standard FIN 45 warranty table.
What Is a Warranty Table?
Let's begin with the warranty table. Quantum's warranty table is part of the notes to the consolidated financial statements, specifically, Note 9: Accrued Warranty Indemnifications, on page 83 of the annual report. It's not necessary to know this background information, but almost seven years ago financial regulators required all companies that guarantee their products with warranties to disclose their warranty finances in all annual and interim financial statements. They did so in the wake of the Enron collapse, which was blamed in part on all the undisclosed financial guarantees the company had made in the years leading up to its bankruptcy.
The Financial Accounting Standards Board, or FASB, issued a ruling, known as FASB Interpretation Number 45, in 2002. The ruling, abbreviated as FIN 45, mentions warranty only briefly, concerning itself mainly with guarantees of real estate, stock prices, salaries, etc. Basically, what FIN 45 said in regards to warranty was that beginning with either their late 2002 or early 2003 financial statements, all companies that use the accrual method to finance their payouts must begin to disclose the beginning and ending balances in their warranty reserve fund, as well as the net additions and subtractions made over the course of the corresponding financial period.
It was simple, but shocking. Suddenly, companies that had never made any warranty disclosures had to begin doing so on a quarterly basis. Warranty costs that used to be closely-guarded as company secrets were there for all to see, if they knew where to look. Warranty Week began collecting warranty statistics in May of 2003, and used it to publish multi-part reports covering the first quarter of that year.
Key Warranty Metrics
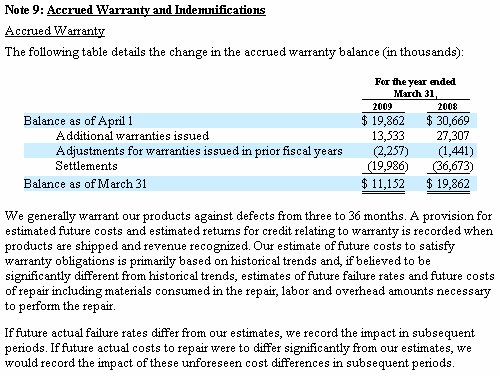
Almost immediately, we began to translate the data into three key metrics: the warranty claims rate, the warranty accrual rate, and the capacity of the warranty reserve. None of those ratios appear in the actual financial statements, which is why so many readers ask about their origin. It's a bit like a price/earnings multiple or a current ratio: all the data is there, but you have to know where to look and what to do with it to produce the right results. So first, let's look at Quantum's FIN 45 warranty table for the fiscal year ended March 31, 2009, as it appeared on page 83 of its annual report.
Source: Quantum Corp. annual report
The best way to identify the warranty table is to first look for a chart, as opposed to a paragraph of text, that includes terms such as warranty, settlements, or provisions. Second, look for an introductory sentence that refers to "the following table." Third, look for a table that includes both a beginning and ending balance, or an opening and closing balance.
In this instance, the opening and closing balances are not labeled as such. Instead, Quantum has dated them April 1 and March 31, and it is left to the reader to conclude that they represent the first and last days of the fiscal year 2009. As a courtesy, Quantum also included the comparable figures for fiscal 2008.
Warranty Words
"Settlements" or "payments" are always code words for claims paid. Some companies label this amount as "reductions for payments." Others use the term "warranty expenditures" or "
"Provision" is always a code word for accruals made. Variations include the plural, "warranties provided," or the singular, "warranty provision."
"Warranties issued" or "additional warranties issued" are also pretty common labels for accruals. Some companies use the more exact label "accruals for warranties issued during the year." And then there are the cryptic terms such as "changes resulting from issuance of new warranties" or "charges to costs and expenses."
They don't make it easy, but in general the largest negative number in the warranty table is usually for claims and the largest positive number (besides the balances) is usually for accruals. Those are the most important figures to collect in order to calculate the claims rate and accrual rate.
For global companies, there will frequently be a line in the table adjusting for foreign exchange fluctuations. As the dollar gains and loses strength, the warranty issuer must adjust the warranty reserve fund balance up or down, based on the current dollar value of the amount they expect to spent on warranty work in other countries. Some refer to this as simply "translation."
There may be an additional line in the table for adjustments made because of recent acquisitions or divestitures, or perhaps increases or decreases to accrual estimates made in previous years that turned out to be too high or too low. In this case, there might be "adjustments for warranties issued in prior fiscal years." Another variation on the language used for this is "changes in liability for pre-existing warranties during the year, including expirations." The key phrases are "pre-existing" or "prior year."
In fiscal 2009, Quantum began the year with $19.862 million in its warranty reserve. It accrued an additional $13.533 million and paid claims amounting to $19.986 million. It also made a $2.257 million adjustment to accruals made in 2008 or before, meaning that it overestimated the need for funds or underestimated the quality of its products. In other words, negative adjustments are good.
The most striking aspect of the warranty table is the closing balance of $11.152 million. That's down significantly over the course of the fiscal year, and is down even more significantly from the $30.669 million balance registered on April 1, 2007. Notice that the explanation underneath the table is completely silent on the reasons behind this.
Warranty on the Balance Sheet
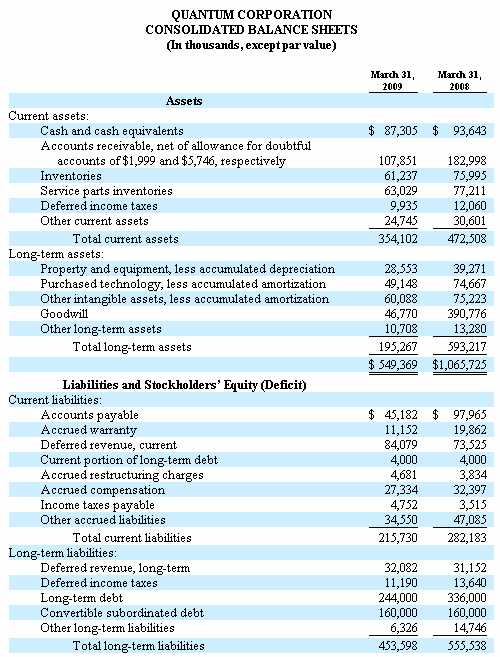
There are two other places in the annual report where warranty figures are mentioned. In the balance sheet, about halfway down, under the heading of Liabilities and Stockholders' Equity, there are two figures for "accrued warranty." Both are balances, hence their inclusion in the balance sheet. And careful readers will note that exactly they're the same as the opening and closing balances in the warranty table of Note 9.
Source: Quantum Corp. annual report
What Quantum is doing here is detailing the opening and closing balances in its warranty reserve fund. Most companies lump those balances into the "other" category, but Quantum chooses to list them separately. Again, that's a courtesy to the reader.
It can, however, lead to an unintentional mistake on the part of the reader, which in turn can lead to an undercounting of warranty costs. The external observer could assume that the "accrued warranty" means these are the accrual amounts for the last two fiscal years. As we saw in the warranty table, the actual figures are $13.533 million for 2009 and $27.307 million for 2008. But here we're offered figures of $11.152 million and $19.862 million -- substantially less than the correct figures for actual accruals.
There are companies that disclose just the opening and closing balances of their warranty reserve fund, ignoring the requirements of FIN 45 to produce a table that also details the net additions and subtractions. It's as if they're providing just the opening and closing balances of their checking account to the taxman, without detailing the deposits and withdrawals. Fortunately for them, the U.S. Securities and Exchange Commission has been so busy trying to figure out how they missed multi-billion-dollar Ponzi schemes that they're in no position to enforce the FIN 45 rules.
Warranty in the Cash Flow Statement
There is one more place where warranty data is typically found. In the cash flow statement, a company will disclose whether the warranty reserve fund grew or shrank in size over the period in question. In Quantum's case, it contracted in size from $19.862 million to $11.152 million over the course of the fiscal year. And lo and behold, the cash flow statement includes a (8,710) notation for fiscal 2009 next to the label "accrued warranty," meaning that the change from $19.862 million to $11.152 million was a decline of $8.710 million.

Source: Quantum Corp. annual report
The shrinkage in fiscal 2008 was even greater at -$10.807 million, and was slightly less in fiscal 2007 at -$8.698 million. But that means Quantum has allowed its warranty reserve fund to contract by more than $28.2 million over the past three years. And indeed, the warranty table shows the balance to have been $30.669 million a year ago.
Here is where it gets a little complicated, however. One would expect to find a warranty reserve fund balance of $39.367 on April 1, 2006, based upon the current balance of $11.152 million and the net contractions of $28.215 reported over the past three years in the cash flow statement. However, the reported balance back then was only $32.422 million.
Accounting for Acquisitions
It turns out that Quantum acquired a data storage company called the Advanced Digital Information Corp. in August 2006, and acquired its warranty reserve fund of $6.945 million as part of that deal. The acquired warranty funds weren't included on the cash flow statement under the heading of "accrued warranty," which as is explained four lines above it, is "net of effects of acquisition." In other words, the $6.945 million that came from ADIC isn't counted there, though it is counted elsewhere.
Again, the inclusion of any warranty figures in the cash flow statement is a courtesy to begin with. Most companies would bundle it into the "other assets and liabilities" figures, rather than list it separately. And some might even try to mislead the reader by omitting the warranty table, declining to detail warranty in the balance sheet, and inviting the reader to mistake the cash flow figures for either net accruals or net claims. They are neither. They are simply the measures of the changes in balances.
As a courtesy, Quantum is including warranty figures in three different charts. Ironically, the only one that provides all the data we need is the third chart, part of Note 9. And we'd have to skim through 83 pages of dense text to get to it. Keyword searches are no shortcut. In fact, in Quantum's annual report, there are 42 uses of the word "warranty" before Note 9 even appears.
So now that you've slogged through the annual report to extract claims and accruals data for fiscal 2009 and 2008, you need something to compare it with. We know that accruals fell by more than half and claims fell by almost half, as measured in dollars. So what does that mean? Is quality increasing? Is repair cost decreasing? We need a ratio.
Internally, many companies measure failures per thousand units, and they might also measure the average cost per repair. That gives them insight into not only product quality, but also product design, ease of repair, efficiency, and other metrics associated with the use of spare parts and the employment of labor.
Externally, we get none of that. We might be told how many units are sold, but we're never told how many fail, or when, or how severely. In fact, in this recession one of the biggest problems for many warranty departments is that the units the sold years ago when times were good are now coming back for repairs when times are bad, staff is short, and money is tight.
As external observers, one of the only metrics upon which we can depend is product sales revenue. And even there, some companies announce only total revenue, which includes not only product sales but also interest income, financial fees, service revenue, and possibly the sales of products that don't normally carry warranties, such as clothing, chemicals, food, books, films, and energy.
What About Implied Warranties?
The lawyers will nail us on that point, no doubt. One cannot pump tap water into a car and call it gasoline. One cannot sell shoes that fall apart the first day they're worn. Everything has an implied warranty of merchantability -- even sandwiches and Harry Potter books. But they have no express written product warranty, and there are probably no warranty reserves or accruals being made to satisfy disgruntled customers.
When we examine a company -- and we track more than a thousand manufacturers and retailers in 15 different industries -- we look for the most relevant pool of revenue. That means no royalty revenue, no service revenue, and no financial revenue -- nothing that is not associated with a product that's sold with a warranty.
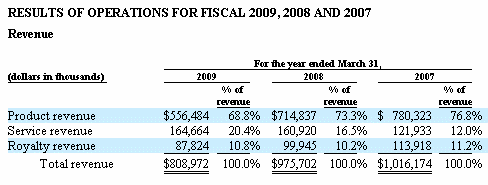
In Quantum's case, then, the $808.972 million they reported in total revenue in the income statement is not sufficient. We need a figure for just product revenue. Fortunately, Quantum breaks this out for us in a chart on page 32 -- and does so again as part of its income statement on page 59.
Source: Quantum Corp. annual report
Some companies prefer to break out their revenue by geography, or by division, rather than by type. If there are service operations in every country or in every division, this makes it difficult to find a figure for just product revenue. Sometimes we wonder if this is not a deliberate obfuscation, intended to disguise or obscure a company's heavy reliance on income sources such as extended warranties, out-of-warranty repairs, or monthly fees of one sort or another. But that's just our opinion.
Calculating Key Percentages
From the figure above, we see that Quantum's product revenue in fiscal 2009 stood at $556.484 million, down from $714.837 million in fiscal 2008 and $780.323 million in fiscal 2007. Now we have to figure out percentages.
In fiscal 2007, accruals were $23.208 million and claims were $31.906 million, while product sales were $780.323 million. Therefore, as a percentage of product sales, the accrual rate was 3.0% while the claims rate was 4.1%.
In fiscal 2008, product sales fell by 8.4% but both claims and accruals rose. Product sales declined to $714.837 million. Accruals rose to $27.307 million. Claims rose to $36.673 million. The accrual rate rose to 3.8%. And the claims rate rose to 5.1%.
In fiscal 2009, product sales fell by 22.2% to $556.484 million. But claims and accruals fell much faster. Accruals declined to $13.533 million. Claims fell to $19.986 million. The corresponding percentage rates fell to 2.4% and 3.6%.
Quantum has been disclosing this information on a quarterly basis since early 2003, so we have collected data from seven annual reports and 18 quarterly reports. In the figure below, therefore, there are 25 data points for the claims rate (red line), 25 data points for the accrual rate (green line), and 25 data points for claims paid (the blue bars).
Quantum Corp.
Warranty Claims & Accrual Rates, 2003-2009
(in dollars and as a percentage of product sales)
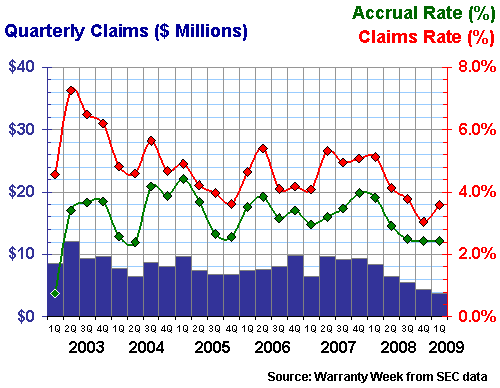
It's immediately noticeable how both claims and accruals have trended down for the past five or six quarters, and how claims at least hit a new low at the end of calendar 2008 (Quantum's third fiscal quarter). Paying out less is a good thing. Paying out less as a percentage of sales is even better.
Warranty Reserve Ratios
There's one more aspect of Quantum's warranty data that needs exploring, and that's the curious drop-off in warranty reserves. At the end of fiscal 2007, the company had $30.669 million in its warranty reserve fund. By the end of fiscal 2008 that balance had fallen to $19.862 million. And at the end of March 2009, reserves fell to only $11.152 million, their lowest level ever (or at least the lowest since reporting began in 2003).
Warranty Week has also collected warranty reserve balance figures for the past seven years and the 18 quarters in between. But again, just the amount doesn't say much. The more relevant measure is the capacity to pay claims. For if Quantum is issuing product warranties with durations between three and 36 months, as its annual reports asserts, then it had better be setting aside an amount equal to what it expects to pay out over the life of those warranties.
What we need to do is take a measure of the warranty reserve balance, and calculate the claims payout each month, and divide one figure into the other. That will give us an estimate of the current capacity of the warranty reserve to pay claims, as measured in months.
In other words, if claims are being paid at a rate of $3 million per month, and the warranty reserve balance is $21 million, then the capacity of the warranty reserve is seven months. If the claims payment rate drops to $2 million per month, and the reserve balance drops to $18 million, the reserve's capacity would rise to nine months. And so on.
In the figure below, we've taken the 25 annual and quarterly claims payment figures and the 25 year- and quarter-ending warranty reserve balances from 2003 to 2009, and performed those calculations. The purple bars represent the balances. The dark blue line represents the capacities.
Quantum Corp.
Warranty Reserve Balances & Capacity, 2003-2009
(in dollars and in months)
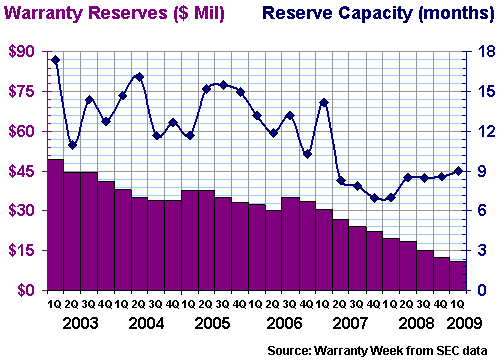
As one can see, Quantum has allowed its warranty reserve balance to steadily decline over the years, which already we knew from the financial statements reproduced above. What we suspected, and what this chart confirms, is that this also represented a decline in coverage, and in the capacity to pay claims.
Back in 2003 the capacity was as high as 17.4 months. And even at the beginning of calendar 2007 it was as high as 14.2 months. In other words, Quantum maintained a warranty reserve balance that used to be roughly equal to what it paid out in claims in 12 to 18 months. And the balance was always somewhere between $30 and $45 million.
But then in the past two fiscal years, corresponding to period spanning the second calendar quarter of 2007 to the first calendar quarter of 2009, Quantum allowed its warranty reserves to contract, and its capacity to fall. A year ago, the capacity fell as low as seven months. Now, it's back up to nine months, based on a balance of $11.152 million and an average monthly payout of $1.667 million.
Reasons Behind Falling Costs?
These figures in and of themselves don't tell us if Quantum's product quality has risen or if repair costs have fallen, however. For instance, had the company cut its warranty durations from three years to 90 days, we might have seen the same result. But in the absence of non-quality- and non-repair-related explanations, these graphs strongly suggest that warranty costs are falling in terms of both amounts and as a percentage of revenue. However, sales are falling too, so maybe this isn't such a good story to tell to shareholders?
But there you have it. That's the process. The collection of 25 warranty tables and 25 product revenue figures results in two charts -- one for claims and accruals and the other for warranty reserves. In this case, the story they tell is of a data storage company that has reduced its warranty settlement costs dramatically, while adjusting provisions proportionately and allowing its reserves to decline.
Repeat this procedure 25 times for a thousand companies over seven years and you have a time series for the warranty expenditures of all publicly-traded and U.S.-based manufacturers and retailers who issue product warranties to their customers and use the accrual method to account for them.
Any questions?


