Warranty Claims & Accrual Rates:
Half the industry segments follow seasonal patterns, with claims and accrual rates peaking during the same quarter every year. Four segments are following downward trends while two are on upward slopes. But what's most surprising is how small the fluctuations have been over the past 15 quarters.
After nearly four years of making quarterly reports on their warranty spending totals, American manufacturers are proving to be a predictable lot. Although warranty spending at any one company might vary considerably from one quarter to the next, what goes up at one company usually comes down at another, so the totals hardly move.
In fact, what seems to matter more when computing the ratios for claims and accruals as a percentage of sales, are the totals for sales. And although highly seasonal products such as snowmobiles and lawn mowers also generate highly seasonal peaks and valleys for repair costs, these have also become highly predictable after nearly four years.
Even when they do oscillate seasonally, however, the claims and accrual rates tend to fall within a narrow range over time. We took a look at 13 different industry segments over 15 quarters, and only three showed a difference of more than 1% between its highest peak and lowest valley. Only five showed a fluctuation between 0.5% and 1%. The remaining five varied less than 0.5% from their highest high to their lowest low.
In the charts below, we've plotted the 13 industry segments, stretching the vertical axis as far as possible to highlight the fluctuations in the claims and accrual rates over time. Claims are in red while accruals are in green. The percentages represent the share of warranted product revenue that's consumed by warranty expenses. The higher the percentage, the more is being spent on warranty as a proportion of sales.
Let's start with the industry segment consistently showing the highest claims and accrual rates as a percentage of product sales, and work our way down to the industry segment with the lowest claims and accrual rates.
Computer Warranty
The computer industry, which includes manufacturers such as HP, Dell, Apple, IBM, Sun, and Gateway, may not pay out as much for warranty as the automotive industry, but as a percentage of sales, it's slightly ahead. Computer makers consistently pay out between 3.15% and 3.75% of their product revenue to honor current claims, and they consistently set aside between 3.35% and 4.0% of their product revenue in accruals to finance future claims. That means the difference between the highest high and the lowest low is only 0.8%.
Figure 1
Warranty Claims & Accrual Rates
in the Computer Industry
2003 to 2006
(% of product sales)
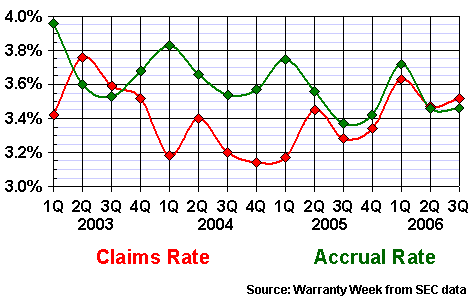
In this graph, there seems to be some seasonality to accruals, with the annual peaks all occurring during the first quarter of the year. Claims, meanwhile, seem to peak during the second quarter of each year, except last year, when they peaked at 3.6% during the first quarter.
Undoubtedly, these totals will change somewhat when Dell Inc. files its late financial reports. And because Dell is such a large part of the computer industry, the totals could change significantly if the company is forced to restate its warranty accounting retroactively as part of a settlement with the U.S. Securities and Exchange Commission.
Automotive Warranty
One might think that because the automotive industry accounted for almost half the $27.3 billion counted in claims paid during 2005, and because General Motors and Ford are the two largest U.S.-based warranty providers, that the automakers also must have the highest payout rates of all manufacturers. But one would be wrong.
The automakers, or what we're calling the automotive OEMs (vehicle makers), are in second place when it comes to claims and accrual rates. Their collective claims rate has been amazingly stable, fluctuating from 2.41% to 2.67% over the past four years. Accruals have varied a bit more, peaking at 2.85% in 2005 before falling to 2.33% in early 2006.
Figure 2
Warranty Claims & Accrual Rates
in the Automotive OEM Industry
2003 to 2006
(% of product sales)
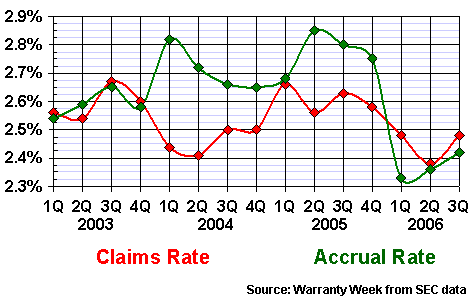
The numbers may change a bit once Navistar catches up on a year of late financial reports. And if the accusations now flying between Navistar and Ford over excess claims for the diesel engines in the F Series light trucks is any barometer, it's a good bet that the totals will rise once the late reports come in.
However, remember that these percentages are weighted averages, meaning that first all the claims and accruals are added up, and then all the product revenue is added up. Then one is divided into the other. Therefore, the weight of GM and Ford matters much more than any other OEM's, and indeed the weight of Navistar is less than that of Caterpillar, Paccar, and John Deere. Still, when we last heard from Navistar, its 2.4% claims rate was somewhat below the industry average.
Of course, the claims and accrual rates are always a negotiation between warranty and sales, so one could suspect that one of the reasons for such stable rates is stable sales. But of course, the automakers have seen considerable fluctuations in sales lately, which makes this stability all the more remarkable. We suspect it has more to do with some extremely careful monitoring of sales and repair trends, followed by constant adjustments to warranty accruals.
Data Storage
The third highest claims and accrual rates are seen within the data storage industry, which encompasses everything from the pocket-sized USB flash drives of SanDisk to the huge storage arrays of EMC Corp. Or perhaps we should make that statement in the past tense, because as Figure 3 illustrates, there has been a consistent downward trend within the industry over the past four years.
Figure 3
Warranty Claims & Accrual Rates
in the Data Storage Industry
2003 to 2006
(% of product sales)
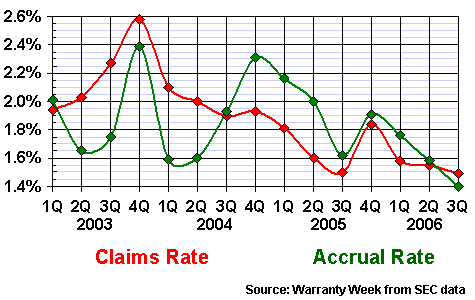
Data storage manufacturers saw a peak for both claims and accruals during the fourth quarter of 2003, when they paid out 2.58% of sales for warranty claims and set aside 2.39% of sales for warranty accruals. And they saw their collective trough during the most recently counted quarter, when claims stood at 1.49% and accruals stood at 1.40%.
We can't really see a clear reason for this from the data, except to suggest that it's a happy coincidence between good sales and low warranty expenses. In dollar terms, the third quarter of 2006 was only the third lowest for claims and the fifth lowest for accruals. But because sales were so strong last year, those expenses were spread over more revenue, resulting in the lowest percentages.
Interestingly, for three years the largest warranty provider in this industry segment was Maxtor Corp. And now that Seagate Technology has acquired Maxtor, the combined companies are spending more on warranty than both did separately. But because of strong sales gains, their combined claims and accrual rates are somewhere between where they were when both companies were separate (see Figure 9 in the Dec. 12 newsletter for details).
Telecom Warranties
We noted in the last issue how warranty claims at Lucent have varied so tremendously over the years, from a relatively high level in 2003 to a rather low level in 2004-2005 and something in between during 2006. Some of the curvature in Figure 4 is undoubtedly caused by that. However, Motorola , Cisco, and Nortel are each larger warranty providers than Lucent. And despite Lucent's fluctuations, there does seem to be the tiniest of seasonal patterns to the data in Figure 4.
Figure 4
Warranty Claims & Accrual Rates
in the Telecom Equipment Industry
2003 to 2006
(% of product sales)
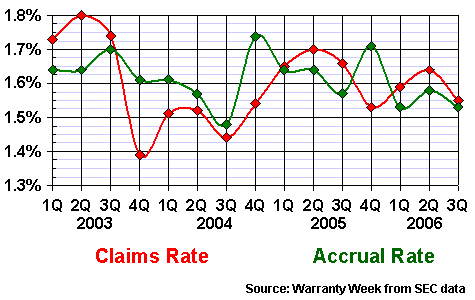
Notice how warranty claims rates seem to peak during the second quarter of each year and then fall to a low during the fourth quarter. It's not as pronounced a pattern as you'll see further down in this article for some other industry segments, but it is nevertheless there. And despite the seemingly chaotic nature of the data, there's only about 0.4% of space between the highs and the lows, which is among the least variable of all 13 industry segments.
Appliance Warranty
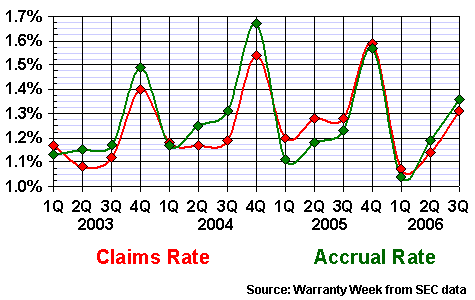
The fifth highest claims and accrual rates can be found in the major appliance and HVAC industries. And, as the curves in Figure 5 illustrate, this industry segment also shows the most pronounced seasonal effect. For three years running, both claims and accruals peaked during the fourth quarter, and when the last of the 2006 annual reports are filed in March, we expect it to be four years in a row. The troughs of each year, meanwhile, are always in the first or second quarter.
However, as much as we tried to exaggerate the curvature for this segment in Figure 5, the truth is that the distance between the highest peak and the lowest trough is only 0.6%. It's almost 1.2% for data storage and over 0.8% for computers, even though those segments may appear more stable from the shape of their curves.
Figure 5
Warranty Claims & Accrual Rates
in the Major Appliance & HVAC Industries
2003 to 2006
(% of product sales)
We should note that United Technologies was counted wholly within the aerospace industry, despite its ownership of Carrier. Johnson Controls is counted as an auto parts supplier, despite its ownership of York. However, American Standard is counted in this segment instead of in building materials, because of its ownership of Trane. We could probably move the averages significantly if we made different choices for which company goes where.
Semiconductor Warranty
The makers of semiconductors and the machinery that helps to manufacture semiconductors would seem to be a seasonal business, from a glance at Figure 6. Indeed, for three years in a row, both claims and accruals have peaked during the fourth quarter. The problem is, the highest claims and accrual rates of the past four years came during the second quarter of 2003, and the claims and accrual rates during the first quarter of 2003 were also on the high side.
Figure 6
Warranty Claims & Accrual Rates
in the Semiconductor Industry
2003 to 2006
(% of product sales)

The good news is that both claims and accruals have been on a downward trend in this segment. And while the lowest claims rate came in 2004, the second- and third-lowest claims rates came more recently, in 2006.
We're missing recent financial reports for both KLA-Tencor Corp. and Coherent Inc., but all the other major players are present and accounted for. What will be more interesting to see is whether claims and accruals will once again peak during the fourth quarter. But we won't know that for at least two more months.
Aerospace Warranty
As mentioned, the entire warranty expenditures of all the divisions of United Technologies are counted in the aerospace segment, alongside the commercial aviation operations of Boeing, General Dynamics, Raytheon, and others. International companies such as Bombardier, Embraer, and Airbus are not counted here, because they do not report their warranty expenditures to the SEC.
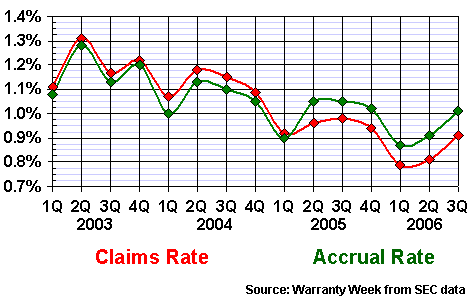
As can be seen in Figure 7, there is a definite downward trend within this segment. However, it's only 0.5% from the highest high to the lowest low. And remarkably, there's never more than 0.1% space between the claims and accrual rates, which means these manufacturers are even more consistent than the automotive OEMs or the appliance manufacturers.
Figure 7
Warranty Claims & Accrual Rates
in the Aerospace & Marine Industries
2003 to 2006
(% of product sales)
Unlike in other industries such as computers and automotive, where we try to separate the suppliers from the OEMs, in the aerospace and marine industries we're counting everything together. So this is also the home of suppliers such as Honeywell International, Rockwell Collins, and Goodrich Corp. That probably has an effect on the data.
No Seasonal Patterns?
There doesn't seem to be any seasonal pattern in the aerospace data, which is not a bit surprising. It's probably to be expected with appliances, which are somewhat affected by holiday sales and heavily affected by builders who follow the seasons. But a seasonal pattern with PC peripherals and medical/scientific equipment? Who could have predicted that? And who would have predicted a complete lack of seasonality in new home warranty expenditures? Those are just some of the surprises in Figures 8, 9, and 10.
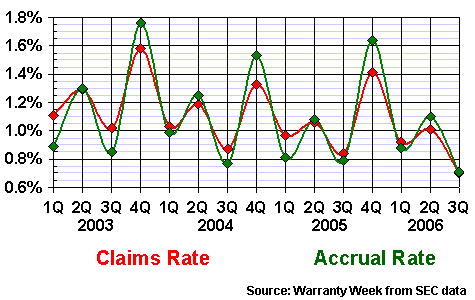
When we say peripherals, we mean primarily printers. However, the members of the segment pictured in Figure 8 also include makers of bar code scanners, monitors, copiers, electric signs, scoreboards, ID card swipes, and batteries. With all that heterogeneity, it's even more surprising that they would show such a seasonal pattern. But there it is: three peaks in the fourth quarter and four valleys in the third quarter.
Figure 8
Warranty Claims & Accrual Rates
in the Computer Peripherals Industry
2003 to 2006
(% of product sales)
The PC printer sales model skews warranty expenses tremendously, by keeping hardware prices very low, and relying heavily on a steady stream of aftermarket sales of supplies. That results in artificially high warranty costs for printer-only manufacturers such as Lexmark International, which has kept its claims rate between 8% and 11% for the past four years, because more than half its revenue comes from sales of non-warranted products such as ink and toner.
One would expect that since Lexmark is the largest warranty provider in this segment, the claims rate would be much higher than the o.7% to 1.6% range seen here. But it's tempered quite effectively by the much larger revenue streams of the other members of the segment, and their correspondingly lower warranty expenses. Suffice it to say that while printers generate some of the highest warranty costs of any product, other peripherals are generally on the low side.
Medical & Scientific Equipment
We can't begin to explain the obvious seasonality of claims and accruals in among the makers of medical and scientific equipment, except to say that at least it's a consistent pattern. Every third quarter, claims and accruals soar, and six months later, they plummet. Could it have something to do with sales patterns? Do most doctors call in for repairs just before they leave town for their summer holidays? Or does this equipment simply hate the heat and love the cold?
Figure 9
Warranty Claims & Accrual Rates
in the Medical & Scientific Equipment Industries
2003 to 2006
(% of product sales)
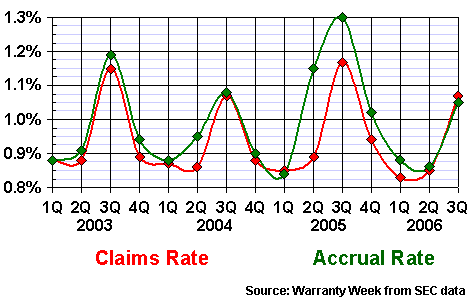
In spite of the hot and cold cycle in Figure 9, there is not a tremendous gap between the top and the bottom. Surprisingly, it's one of the five segments that have fluctuate less than 0.5% over the past four years. So even though the scale of the vertical axis in Figure 9 makes it look chaotic, it's actually quite stable.
New Home Warranties
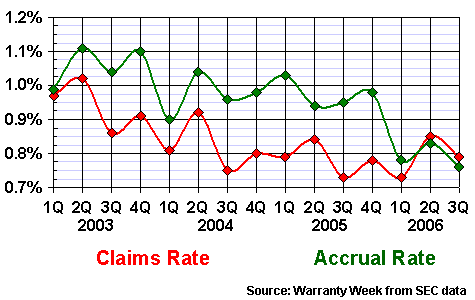
The new homebuilding industry also shows some remarkable stability when it comes to warranty expenses, but what's really surprising is the complete absence of any seasonal pattern. Both the act of building and selling a home would seem to be extremely weather-dependent. And by the way, this segment is exclusively for new homes, and has nothing to do with the third-party "home warranties" that frequently accompany resales.
If anything, this segment shows a downward trend on a saw tooth pattern. Almost every "up" quarter is followed by a "down." But while the highest claims and accrual rates were seen in early 2003, the lowest for both occurred in 2006. Then again, it's less than 0.4% of a gap between the highs and the lows.
Figure 10
Warranty Claims & Accrual Rates
in the New Homebuilding Industry
2003 to 2006
(% of product sales)
Just when one would conclude that there is no seasonality to new home warranty claims (or at least warranty and sales fluctuate closely in parallel), along comes the building materials segment. One would expect this segment to closely follow new homebuilding patterns, since its members make things such as cabinets, carpet, faucets, pumps, pools, windows, roofs, insulation, furniture, and flooring. But one would be wrong.
While homebuilding warranty data shows no seasonal fluctuation, homebuilding materials clearly do. Claims and accrual rates are highest in the fourth quarter, when winter is approaching and sales are lowest. Claims and accrual rates are lowest during the second and third quarters, when activity is at its peak and sales are at their highest levels of the year. This is the expected pattern, while Figure 10 is the anomaly.
Figure 11
Warranty Claims & Accrual Rates
in the Building Materials Industry
2003 to 2006
(% of product sales)
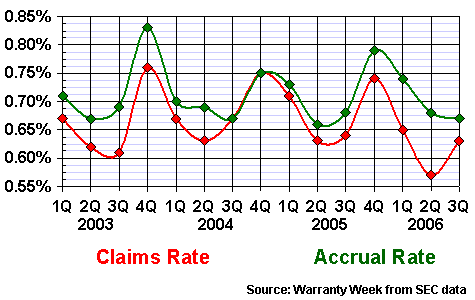
In truth, however, though there is a clearly seasonal pattern to the data, the gap between the highest high and the lowest low is only 0.26%, making this one of the most stable of all the industry segments. If we drew this on the same scale as some of the others, the curves would flatten out immensely.
Auto Parts Warranties
Speaking of stability, the auto parts supplier industry segment wins the title for the least variation between the highest and lowest claims and accrual rates. The highest accrual rate came at the end of 2005 with 0.72%. The lowest claims rate was seen in 2004 at 0.51%. That's a gap of only 0.21% -- smaller than even the building materials segment.
Figure 12
Warranty Claims & Accrual Rates
in the Auto Parts Supplier Industry
2003 to 2006
(% of product sales)
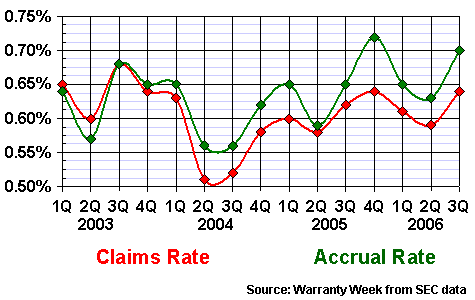
While individual suppliers such as Visteon have seen a tremendous increase in their warranty expenses, the industry as a whole has seem claims and accruals rise and fall more or less proportionately with product sales. For while the $472 million paid to the OEMs to satisfy claims during the third quarter of 2006 was a record high, the 0.64% of revenue that this amount represented was only the fifth highest claims rate of the past 15 quarters. In fact, the highest claims rate of all came back in 2003, when supplier recovery hadn't yet become such a hot topic.
Then again, those who believe the glass is half-full can point to the shrinking gap between the automotive OEMs and their parts suppliers. Indeed, the gap twice exceeded 2.0% during 2005, yet it has not been above 1.9% during 2006. And it has never been lower than the 1.79% gap seen during the second quarter of 2006. So perhaps the OEMs are now somewhat successful in their effort to shift more of their warranty expenses back to their suppliers. But it's all mere fractions of a percent.
Consumer Electronics Warranty
We saved consumer electronics for last for two reasons. First, as Figure 13 makes clear, it is the only industry segment to show a consistent upwards trend. Second, as is not obvious at all, this graph presents an incomplete and misleading picture of the consumer electronics industry.
The problem is that almost everything one would ordinarily consider to be a consumer electronics item is made outside the U.S. and imported by foreign-owned firms, with the exception of some digital cameras and MP3 players, which are manufactured abroad and imported by U.S.-based firms such as Apple and HP. But those companies are counted in Figure 1 as computer companies, leaving this segment to be dominated by makers of navigational equipment, radar detectors, car audio, surge protectors, game consoles, and musical instruments.
Therefore, Figure 13 is comprised of nothing but odds and ends that happen to be made in the USA, and is missing all the mainstream brand names that sell flat screens, cameras, disc players, satellite receivers, digital recorders, and audio amplifiers. So we suggest you take that into account when trying to attach meaning to the data in this chart.
Figure 13
Warranty Claims & Accrual Rates
in the Consumer Electronics Industry
2003 to 2006
(% of product sales)
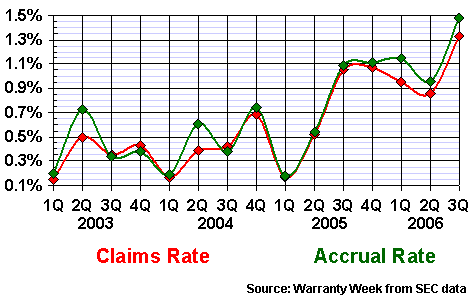
One would think that the consumer electronics segment was seasonal, based on the second-quarter peaks and first-quarter valleys seen in 2003, 2004, and 2005. But then claims and accruals continued climbing in 2005, and have continued to do so in 2006. One reason is the rising warranty expense reported recently by Harman International, American Power Conversion, and Garmin. Overall, in dollar terms, claims are up 32% in this segment, from $85 million during the first nine months of 2005 to $113 million during the first nine months of 2006. Obviously, sales gains have not kept pace.
Warranty Financial Management
Next week, Greg Spraker of SAS Institute is publishing part two of his series on Warranty Financial Management. This time, the focus will be on optimizing warranty reserves. And so, before we get to that, we though it might be useful to check in on the U.S. warranty industry as a whole.
As of September 30, 2006, the total warranty reserve fund balance reported by all U.S.-based manufacturers stood at $39.461 billion, up a very slight 0.08% from the $39.429 billion recorded a year before. This total could change, depending upon what Dell, Navistar, Delphi, KB Home, and two dozen other past-due filers eventually report. For now, we're carrying their last reported balance forward to the end of the third quarter.
For the first nine months of 2006, we're up to $20.733 billion in reported warranty claims paid, up a slight 1.2% from the $20.494 counted during the same period of 2005. Accruals stand at $20.594 billion, which is actually down 3.6% from the $21.353 billion counted during the first nine months of 2005. Where necessary, we're inserting place-saving estimates for the late filers, which we will correct as their actual numbers become available.
Compared to a year ago, therefore, claims are up slightly, accruals are down noticeably, and the ending balance in the reserve funds is up just a bit.
How Does Your Organization's After-Market Performance Rank?
There is still time to benchmark your organization's service after sales function. Warranty Week and APQC, a nonprofit benchmarking and research organization, are offering you the opportunity to collect data on current service after sales practices and performance by participating in the Open Standards Benchmarking Collaborative (OSBC) research, sponsored by IBM. Due to overwhelming response to this survey, we have extended the date by which you can submit your data and be eligible for exclusive benefits.
Visit www.apqc.org/warrantyweeksurvey to submit your organization's data by Feb. 15 at no cost. In addition to a complimentary report comparing your responses with those of others who have participated, you will receive two of APQC's best-selling publications:
- Inventory Optimization: Balancing the Asset versus Service Tradeoff, a new best-practice report with case studies that retails for $495, and
- By the Numbers: Logistics, a benchmark and measures report that retails for $299.
- interacting with customers,
- managing product returns,
- performing product service,
- managing service repair parts,
- pursuing value-adding service offerings, and
- recovering value through product refurbishment.
A Note About Data Privacy and Confidentiality
This study is an ambitious effort to gather high-quality data on the service after sales function. On behalf of Warranty Week and APQC, we would like to affirm our commitment to keeping all your company and personal information entirely confidential. Only the members of our joint research team will have access to this data, and your information will not be used for any marketing or sales activity.


