Telecom Warranties:
While the ups and downs of the heavyweight manufacturers throws off the averages, it appears that TV and radio broadcast equipment generates half as much in warranty claims as newer technologies such as cellular and Internet gear. Are telecom warranty rates related to the maturity of the technology or the age of its manufacturers?
In last week's column, we sliced and diced the automotive market into smaller, more meaningful units of warranty. This week, it's the telecommunications equipment category that needs some slicing. Just as a truck warranty isn't the same as a motorcycle's, neither is an Internet router the same as a TV transmitter tower.
In information technology as in automotive, different products have different "natural" rates of warranty cost. Warranty claims and accrual rates for million-dollar semiconductor manufacturing machines may be in the tenths of a percent, but for something as commoditized as a PC printer, the "natural" rate of warranty expense might be above 10% of revenue. And that might be expected and sustainable, given the profitability of paper and ink supplies.
Warranty Week has found that within the broad telecom equipment heading, the highest "natural" rates for warranty claims and accruals come with Internet and data communications gear, and the lowest come with TV and radio broadcasting equipment. Somewhere in between those two extremes are the claims rates for five other sub-categories of telecom equipment.
Seven Categories
For simplicity, we've divided the universe of 150 telecommunications equipment manufacturers into seven rather broad and sometimes overlapping categories: plain old telephone, wireless, broadcasting, cable TV, satellite, data communications, and broadband. Rather than getting bogged down in definitions, here are the category headings and several examples of the manufacturers and the products they make:
Plain Old Telephone
Product Examples: PBX, voicemail, fax, central office switches, telephones
Leading Manufacturers: Nortel, Lucent, Avaya
Wireless Telephone
Product Examples: cellular base station, mobile handsets, switching equipment
Leading Manufacturers: Motorola, Nortel, Lucent
TV & Radio Broadcasting
Product Examples: TV & radio transmitters, towers, broadcast equipment, audio and video editing equipment
Leading Manufacturers: Cobra, SPX, Avid Technology
Cable TV
Product Examples: Set-top box, cable modem, head end, amplifiers, switching equipment, pay per view
Leading Manufacturers: Scientific-Atlanta, JDS Uniphase, Broadcom
Satellite & Microwave
Product Examples: GPS navigation, earth stations, VSAT, DBS, microwave, radar, air traffic control
Leading Manufacturers: Harris, Garmin, Stratex
Data Communications
Product Examples: router, LAN, modem, multiplexer, firewall
Leading Manufacturers: Cisco Systems, 3Com, Juniper Networks
Broadband
Product Examples: Fiber optic switches, DSL, T1, ISDN, videoconferencing
Leading Manufacturers: Lucent, UTStarcom, Ciena
In previous issues, we've examined warranty in several other closely allied areas of information technology manufacturing such as computers, disk drives, printers, semiconductors, and printed circuit boards. That analysis need not be repeated again now. Please see the March 30 column for that data. This time, we're including manufacturers of cellular and landline telephones here, but televisions and radios are lumped in with consumer electronics, which is not covered here. Fax broadcasting gear, fax servers, and voicemail systems are included here, but fax machines are not. They're lumped in with copiers in the office machine category. Modems, network cards, and Internet routers are included here, but the actual computers and terminals are not. As mentioned, it's easy to get bogged down with the definitions and boundaries of each category. It's better to rely on the examples above.
Overall, the 350 companies under the broadest definition of information technology equipment manufacturers experience both claims and accrual rates that are consistently close to 2.4%. This we will call the "natural" rate of warranty activity for IT manufacturing. As detailed in past issues, computer manufacturers are generally above this average while data storage manufacturers are somewhat below it. Semiconductor and printed circuit board manufacturers are far below that average, as are most types of computer peripherals besides printers. All those manufacturers of computers, disk drives, peripherals, and semiconductors previously covered in the March 30 column are excluded here.
What we're doing this week as a fifth and final look at the 2003 data is splitting up the broader "telecommunications equipment" category into seven smaller product groups. There are 150 warranty-reporting manufacturers under the telecom heading, and there are 20 to 40 manufacturers in each of the smaller groupings. In as many cases as possible, manufacturers were included in just one of the seven groups. This was also done with diversified PC/disk/peripheral manufacturers in the March 30 issue, and with truck/bus/car manufacturers in the April 13 column.
To avoid artificially weighting or duplicating the data, the big companies are counted just once in one category -- the one that comprises their core business. At its core GM is a passenger car manufacturer, though it also makes train locomotives. At its core Lucent and Avaya are telephone equipment companies descended from Ma Bell herself. At their core, Hewlett-Packard and IBM are computer companies, though their complete product catalogs would be a thick book. Their spin-offs Agilent Technologies and Lexmark International make test equipment and printers, respectively.
The Dangers of Rapid Weight Loss
In the telecom sector, the only large companies for which multiple categories would have been necessary were Lucent and Nortel. Most others were firmly, or mostly, in just one of the seven categories. Lucent and Nortel, however, have extensive operations in both wireline and wireless telephony, as well as data, fiber optics, and broadband. For two reasons, we include them for this analysis in just one group: the traditional telephone category. First, Nortel's warranty accounting is under review and is likely to be restated in amended SEC filings. Second, Lucent's warranty claims and accruals positively plummeted during the fourth quarter -- so much that it skews the data in whatever category it's placed. With only 20 to 40 manufacturers in each category, the averages are highly susceptible to the weight of a few large manufacturers. And Lucent and Nortel are to telecom what GM and Ford are to passenger car manufacturers.
During the first three quarters of 2003, Lucent's claims and accruals were in a range of $40 to $50 million per quarter. Claims were routinely around 3.5% of product sales, while accruals were closer to 2%. This had the effect of shrinking the reserve from $440 million on Sept. 30, 2002 to $330 million on Sept. 30, 2003. But then in the fourth calendar quarter of 2003 (Lucent's first fiscal quarter), claims fell to only $16 million while accruals fell to $19 million. It's wonderful news for Lucent, but it obscures the purpose of this column.
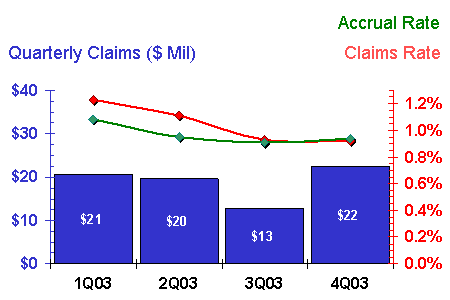
As mentioned, of the seven telecom sectors, manufacturers of TV and radio broadcasting equipment have the lowest warranty claims and accrual rates of all. Perhaps this has something to do with the maturity of that market and the assembly lines that feed it. The makers of TV and radio transmitters, towers, editing and broadcasting equipment in 2003 saw claims and accrual rates very close to 1.0%, as is detailed in the chart below.
Warranty Claims and Accrual Rates
for TV & Radio Broadcasting Equipment
Manufacturers in 2003

Source: Warranty Week
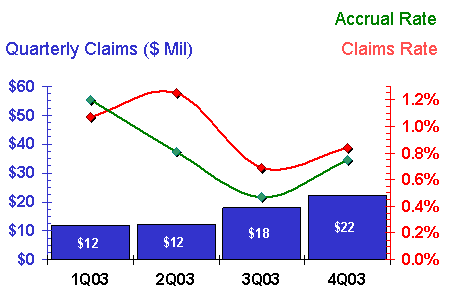
This category includes both the TV towers of SPX Corp. and the video editing consoles of Avid Technology Inc., and has a few unavoidable crossovers with the cable TV industry. So let's look at that industry sub-category next, although as can be seen in the chart below, its claims and accrual rates are somewhat noticeably more volatile.
Warranty Claims and Accrual Rates
for Cable TV Equipment Manufacturers in 2003

Source: Warranty Week
Much of that volatility can be traced back to Broadcom Corp., a manufacturer of that saw claims jump from $54,000 in 2003's first quarter to $5.2 million in its fourth quarter. Accruals varied from $300,000 to $4.6 million. That rise also accounts for most of the quarter-to-quarter growth in claims dollars, as seen in the blue bar graph section of the chart above. All it takes is one appreciably-sized manufacturer to throw claims and accrual rates into a roller coaster pattern. You should see what the warranty ups and downs of navigational equipment manufacturer Garmin Ltd. did to the satellite category. Its graph looks like an Olympic ski jump.
At present, most manufacturers have released only four quarters' worth of warranty data, so there is no dependable baseline yet. Over time, as more warranty data becomes available, the slope of these graphs will flatten out, and it will be more apparent what's the "natural" rate for any given industry or product type. Differences in accounting methodology and product/installed base mix will tend to cancel each other out, if the same small group of competitors is used every time. The goal isn't to conclude that 2.5% is somehow better than 3.0%. The goal is to observe that 2.5% to 3.0% is the range of "normal" rates for a given group, so that if one competitor suddenly goes to 5% or 0.5%, it shows up as an anomaly. Especially when a manufacturer is compared to itself, as is informally done here with Lucent, Broadcom, and Garmin, it becomes readily apparent when a given data point marks a divergence from "normal."
Roller Coaster Diagrams
The telephone equipment market, as mentioned, is difficult to analyze given the swings of Lucent and Nortel and the weight they have on the averages. The range for warranty claims and accruals in that category is a somewhat wide 1.0% to 2.5%. Give us another year of data and we'll tell you which extreme is closer to the historical norm. Right now, the data is so skewed that a graphic would only serve to mislead the reader.
Satellite equipment manufacturers seem to be in another wide range during 2003: anywhere from 0.5% to 1.5%. Broadband equipment, however, seems to be in a much tighter range of 1.1% to 1.4%. This is notable given the relative youth of technologies such as DSL, ISDN, and cable modems, and the reports that fill the industry of problem-plagued installations. One can only conclude it's not the equipment causing the problems, or more properly, the defect is not in the hardware. It's in the installation and/or the installer.
The remaining two groups that we'll look at in detail are among the youngest in the telecom sector. Assuming that the telephone industry got going in the late 1800s, radio in the 1920s, TV in the 1950s, satellite in the 1960s, and cable TV in the 1970s, the Internet/datacomm and cellular telephone markets are children of the 1980s and 90s. Perhaps that is one reason for the volatility in the charts below.
Warranty Claims and Accrual Rates
for Cellular Equipment Manufacturers in 2003

Source: Warranty Week
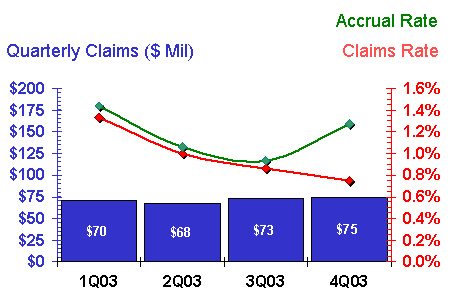
The cellular telephone equipment industry divides into two major types: subscriber handsets and carrier network. There does not seem to be any meaningful difference between the two in terms of warranty claims and accrual rates. Both are in a range of 0.8% to 1.4%, as the chart above details. By the way, don't read too much into the late-year upturn in accruals, as shown by the green line above. Most of that is caused by a late upturn in accruals by Netgear Inc. and Redback Networks Inc., which may in and of themselves be one-time events. More data over time will make this trend clear.
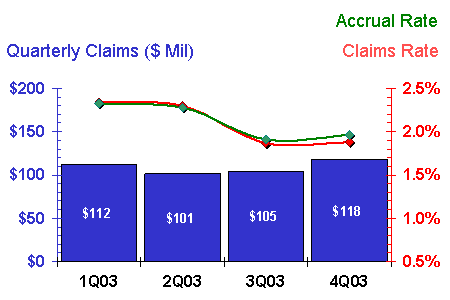
Finally, the data communications equipment industry has claims and accrual rates that are both the highest in the telecom sector and the closest to the observed norms in the computer industry. This seems appropriate given that few of these manufacturers were in business just ten years ago. Give them 50 or 100 years to work the kinks out of their production lines and they also might turn in stable and predictable claims and accrual rates.
Warranty Claims and Accrual Rates
for Data Communications Equipment
Manufacturers in 2003

Source: Warranty Week
In the data communications sector, Cisco, Tellabs, and Extreme Networks showed the most volatility, although the curve is already fairly flat. It seems likely that absent any unseen anomalies, that the "natural" rate of warranty claims and accruals among Internet and data communications equipment manufacturers is in a range of 2.0% to 2.3%. This is significantly higher than the 1% rates seen by broadcast equipment makers, but close to the 3.5% rate turned in by computer manufacturers.
| Back to Part Four |


