Automotive Supplier Warranties:While costs are down, so are sales. And while many suppliers are reporting higher sales in 2010, the proportion between their warranty costs and sales is higher than ever. And that's the unfortunate result of an increased effort by vehicle makers to push more of their warranty costs back onto their suppliers.
As was the case with the automotive OEMs we profiled two weeks ago, automotive suppliers this year are recovering from a very bad 2009. In terms of warranty costs, the 73 U.S.-based companies that reported claims paid in either 2009 or 2010 saw the percentage of sales they pay to their OEMs rise to record heights a year ago, just as sales reached new lows.
It's always been tough to be an automotive supplier. But in 2009, OEMs that were suffering their own sales declines began to get very serious about making suppliers pay their "fair share" of warranty costs. And that trend is beginning to show itself in the industry data.
Recovering in 2010
In Figure 1, we see that warranty claims are once again rising in the third quarter of 2010 -- but only slightly -- from a trough that fell to its deepest point in the second quarter of 2010. At that time claims bottomed out at $383 million. In 2010's third quarter, they rose back up to $427 million.
Figure 1
Automotive Supplier Warranty
Claims Paid, 2003-2010
(in US $ millions per quarter)
But also notice that the deepest trough for claims actually came in the middle of 2004, when claims barely reached $310 million. The highest peak, meanwhile, came in late 2008 at $540 million.
In other words, both the recent peak and the recent trough are a bit behind schedule, given the desperate economic conditions in the automotive industry in recent years. And this lag time is to be expected, given that the OEMs must first pay the claims and then seek reimbursement from their suppliers. And as we've seen with Ford vs. Navistar and now GM vs. Delphi, these finger-pointing affairs can be protracted, complex and painful.
Accruals Mirror Sales Trends
The accrual figures, on the other hand, make a little more sense, peaking in 2006 and 2007, and hitting a low of $360 million during the first quarter of 2009. One would expect that as auto suppliers read the newspapers and look at their own sales figures that they'd be adjusting accruals down to match expectations.
What doesn't make sense in Figure 2 is the up and down of the last four quarters. Accruals fell from $532 million in the last quarter of 2009 to $418 million in the second quarter of 2010, before rising to $458 million in the most recent quarter.
Figure 2
Automotive Supplier Warranty
Accruals Made, 2003-2010
(in US $ millions per quarter)
And so far, at least the dollar figures don't support any theories about increased efforts by OEMs to recover warranty costs from their suppliers. It only begins to make sense when you compare the raw dollar amounts of Figures 1 and 2 to the sales totals, and discover that both claims and accrual rates (as a percentage of sales) hit record highs in the second half of 2009.
Those percentages can be seen in Figure 3. And they reveal that auto parts suppliers paid out a record 0.86% of their product revenue in claims at the end of 2009, while setting aside a record 0.75% in accruals. Neither metric has ever been higher in this industry segment, at least since warranty cost reporting began in 2003.
Figure 3
Automotive Supplier Warranty
Claims & Accrual Rates, 2003-2010
(as a percentage of product revenue)
The question is why. And the answer, we think, has less to do with the recession, or with the lag time between sales and repairs, and more to do with the aggressive efforts by the OEMs to push more of their warranty costs back onto their suppliers. And it's a zero sum gain, in that what the OEM recovers from its suppliers translates into a reduction in its own costs.
Reduced Warranty Costs?
In the November 18 newsletter, we detailed how the OEMs have reduced their claims total from $6.74 billion in the first nine months of 2009 to only $6.08 billion in the first months of 2010. Over the same timespan, suppliers reduced their claims total by $158 million, from $1.41 billion in 2009 to $1.25 billion so far in 2010.
In other words, both industry segments reduced their claims totals by roughly 10%-11%, with the percentage decrease slightly higher for the suppliers. So that data doesn't support the theory that OEMs are shifting more of their claims cost to suppliers than before. In fact, it sounds more like both groups are making their products better than ever, and are paying a smaller percentage than ever for warranty work.
However, there's more to this story, which can only be told by going a level deeper, and comparing the costs of both groups to each other. In 2009, as we detailed in the November 18 newsletter, OEM sales began to fall and OEM claims rates began to soar. But OEM accrual rates continued to slide into 2010. This, we suspect, was partly because the OEMs believed they were building better vehicles, and partly because they expected to increase their reimbursements from suppliers.
Comparing Rates
In Figure 4, the OEMs are depicted in blue and the suppliers are in red. For the OEMs, claims are in dark blue and accruals are in light blue. For suppliers, claims are in red and accruals are in orange. In addition, each data point is also coded as either a diamond (claims) or a triangle (accruals).
The supplier lines at the bottom of Figure 4 are more compressed than they are in Figure 3, but it's the exact same data. Basically, it shows how predictable the OEM and supplier warranty data was for the years 2003 through 2007.
But then something happened. For the OEMs, claims began to rise while accruals began to fall. And for suppliers, both claims and accruals began to rise significantly in early 2009, as both their actual current and expected future warranty costs began to rise.
Figure 4
Automotive OEM vs. Supplier Warranties
Claims & Accrual Rates, 2003-2010
(as a percentage of product revenue)
Notice also how the gap between the pairs of lines has widened and narrowed over the years. At the beginning of 2007, the gap between the OEM and supplier claims rates was 2.0%, while the gap between their accrual rates was 1.9%.
That, more or less, was the average from 2003 to 2007. During those five years, the gap between what the OEMs paid and what their suppliers paid was roughly two percent. And the gap between what the OEMs set aside and what their suppliers set aside was roughly two percent.
Closing the Gap
But then OEM accrual rates began to fall and close the gap, with the percentage difference shrinking to 1.6% by early 2008, and to 1.4% by early 2009. In fact, the gap was only 1.1% by early 2010.
At the same time, the gap between OEM and supplier claims rates at first widened, then narrowed. The gap was still 2.0% throughout 2008. And it actually widened to a record 2.5% in early 2009. But by the start of 2010 it was only 1.6%, and now it's only 1.5%. That's a tremendous change in only two years.
We'd suggest it's been a painful adjustment for many of the suppliers. Among the 67 U.S.-based auto parts suppliers that have so far reported paying claims in 2010, 22 have paid out more in claims in 2010, and for seven of them the dollar increase was higher than 50%.
Only two of those suppliers could cover the increased claims payments with massively increased sales revenue: Energy Conversion Devices Inc. (sales up 77%) and Quantum Fuel Systems Technologies Worldwide Inc. (sales up 244%). And interestingly, both companies are involved with new powertrain technologies: electric cars and hybrid propulsion systems, respectively.
Meanwhile, in terms of accrual rates, there's almost twice as many decreases as increases on our list. Of the 55 suppliers for which we could compare accrual rates at Sept. 30, 2009 and Sept. 30, 2010 (in other words, those which provided full warranty disclosures for the first nine months of each year, and which weren't acquired or didn't declare bankruptcy), only 19 showed increased accrual rates while 36 showed decreases.
Large companies with large increases in their accrual rates included ITT Corp. and Wabco Holdings, while large companies with large decreases included ArvinMeritor and BorgWarner. Some of the large companies that reported relatively unchanged accrual rates included Advance Auto Parts, Standard Motor Products, and TRW Automotive Holdings.
The Engine Business
We'll take a look at some of them in detail in a minute. But first, let's take a look at the one section of the supplier industry where warranty costs seem to accumulate at OEM-like rates: the engine suppliers.
Cummins makes both electrical power generators sold to end users and diesel engines sold to OEMs such as Chrysler. So while it's by far the largest warranty provider in this group (paying out roughly twice as much in claims as Johnson Controls), it's also something of an OEM itself (at least in the generator business).
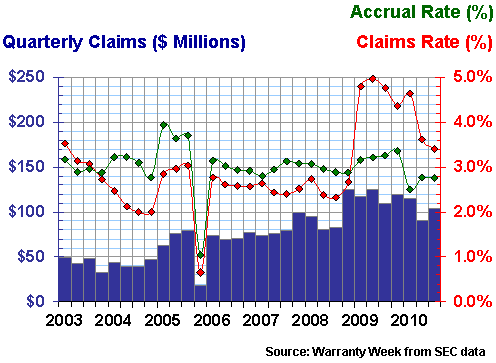
The most noticeable feature of Figure 5 is how it shows claims rates soaring in 2009 while accruals remained around three percent. That, we'd suggest, has more to do with a decline in sales than with an increase in claims. But also notice that claims did in fact rise, surpassing $100 million per quarter in seven of the last eight quarters. So it's a little of both.
Figure 5
Cummins Inc.
Warranty Claims & Accrual Rates, 2003-2010
(as a percentage of product revenue)
The company's claims rate did begin to fall again in 2010, but it's still not back to where it was before 2009. As of Sept. 26, 2010, Cummins had reduced its claims rate to 3.4%, down significantly from 4.8% a year before. But that had more to do with a 23% rise in sales than with a 12% reduction in claims ($310 million vs. $352 million in 2009).
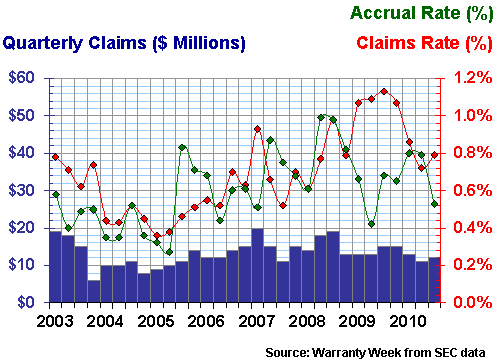
At Dana, the sales increase was smaller (14%) but the claims reduction was the same (-12%). And so its claims rate fell from 1.1% in 2009 to 0.8% by the end of September 2010. And it's obvious from Figure 6 that the company's claims rate was at its highest level in all four quarters of 2009.
Figure 6
Dana Holding Corp.
Warranty Claims & Accrual Rates, 2003-2010
(as a percentage of product revenue)
Dana is also a powertrain manufacturer, but its product line is quite different from Cummins. While Cummins is best-known for the Dodge Ram diesel engines, Dana is more of a supplier of axles, driveshafts, and transmissions. And that difference shows quite clearly in the claims rates. While Cummins gets down to two percent on a good day, Dana gets above one percent only on a bad day.
In other words, while an engine manufacturer can expect OEM-like claims rates, the makers of the rest of the drivetrain components fit comfortably into the typical supplier range. Though we're not spotlighting ArvinMeritor Inc. in this week's newsletter, they're also in that 0.7% to 1.0% range with claims.
Returning to Normal
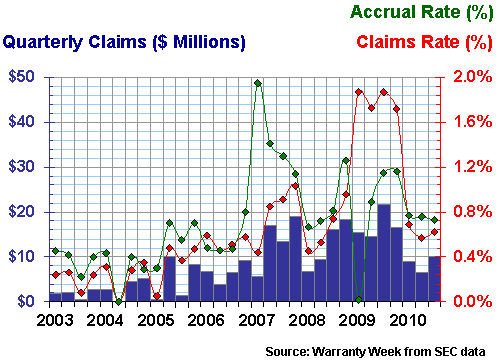
BorgWarner, meanwhile, is once again back in that typical range, after seeing a severe spike in claims last year. As can be seen in Figure 7, claims remained in the 1.7% to 1.9% range during all of 2009. And in that bad dream at the beginning of 2007, its accrual rate nearly touched two percent.
Figure 7
BorgWarner Inc.
Warranty Claims & Accrual Rates, 2003-2010
(as a percentage of product revenue)
BorgWarner's specialties are transmissions, as well as four-wheel drive system components. It also makes clutches, turbochargers, and radiator components. And in 2010, at least, the company's warranty costs are right back where they should be, in that 0.6% to 0.8% range.
Looking at Brakes
Finally, we wanted to take a look at two suppliers somewhat outside the drivetrain segment. In fact, both TRW Automotive and Wabco are best known for their brakes.
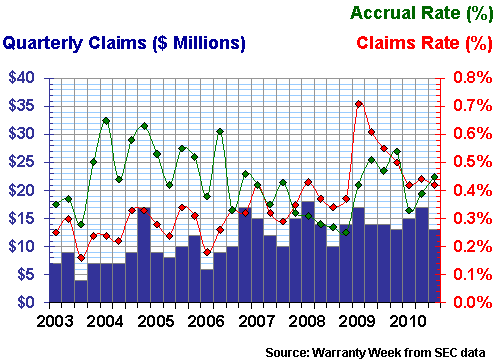
TRW also saw a spike in its claims rate in 2009, and has also brought that rate back down to the "normal" range in 2010. But let's not get carried away. The highest it's ever been was 0.71% in the first quarter of 2009.
Figure 8
TRW Automotive Holdings Corp.
Warranty Claims & Accrual Rates, 2003-2010
(as a percentage of product revenue)
The big difference is that while "normal" for a transmission manufacturer is 0.6% to 0.8%, for TRW it's more like 0.3% to 0.5%. That's not much of a difference, but it illustrates a point: where you are in terms of warranty costs depends heavily on where your parts fit into the vehicle. Engines have the highest costs, drivetrains are a notch down, and brakes are a little lower.
Braking the Pattern
Wabco Holdings has been around in one form or another since 1869. It was founded as the Westinghouse Air Brake Company by George Westinghouse, inventor of the railway air brake. It was acquired by the American Standard Companies Inc. in 1968, from which it was spun off in July 2007. At that time, the rest of American Standard changed its name to Trane Inc.
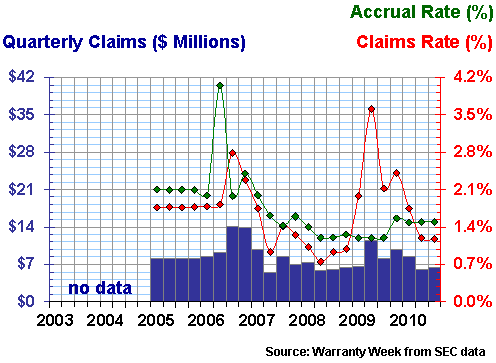
All this trivia explains why there is no data in the Figure 9 chart for the years 2003 or 2004. At the time of the spin-off, Wabco filled in the details about its warranty expenditures in 2005 and 2006. But it didn't provide data going further back than that. And American Standard's data for those years was heavily weighted towards its HVAC product line.
Still, now we have nearly six years of warranty data to look at. So it's somewhat curious to see that even though Wabco is primarily a brake manufacturer, the data in Figure 9 makes it look more like an engine manufacturer.
Figure 9
Wabco Holdings Inc.
Warranty Claims & Accrual Rates, 2003-2010
(as a percentage of product revenue)
In its most recent annual report, Wabco notes that its warranty expense has fluctuated between approximately 1.3% and 2.4% of sales. And while it's very good about doing the math for its investors, there's not much of an explanation as to why its warranty costs consume a much larger share of sales than is the case at competitors such as TRW Automotive, Dana, or ArvinMeritor.
We don't want to compare the companies too directly, however. In other words, we don't want to imply that TRW's products are somehow "better" because the company's latest claims rate is half of either Dana's or ArvinMeritor's.
There is a lot that goes into each company's warranty cost accounting methodology that makes them difficult to compare to each other. But in the last 23 quarters, Wabco has seen its claims rate rise above two percent in five quarters, and fall below one percent in four others. So what we're saying is that Wabco has yet to form a consistent baseline to which its own track record can be compared.
Product Warranty Series
This is the ninth in a series of 11 industry-by-industry newsletters that examine product warranty claims and accrual trends in detail over the past eight years. Links to the others in the series are included below, in case you've missed any.
September 16: Computer Warranty Claims & Accruals
September 23: Data Storage Warranties
October 7: HVAC & Appliance Warranties
October 14: New Home Builders & RV Maker Warranties
October 21: Construction Equipment Warranties
November 5: Aerospace Warranties
November 11: Security Equipment Warranties
November 18: Automotive OEM Warranties
December 2: Automotive Supplier Warranties
December 16: Medical & Scientific Equipment Warranties
December 23: Telecom Equipment Warranties
| 


