Automotive OEM Warranties: As sales volumes recover, warranty costs are falling to unbelievably low levels. That's partly a side effect of the dismal truth that there are fewer two- and three-year-old vehicles in use. But it's also proof that those newer vehicles are built better than before and will need less warranty work over time.
Automotive OEMs are coming back to life, and are reporting some of their lowest warranty costs ever in the first three quarters of 2010.
Today is the day we welcomed back General Motors Co. to the roster of public companies, following the enthusiastic reception afforded to its initial public offering yesterday. Shares of GM closed at $34.19 on Thursday, up significantly from Wednesday's $33.00 IPO price. Volume was extremely heavy, with more than 450 million shares changing hands by the end of opening day.
All year, the company has set the pace in the industry by keeping its warranty costs at some of their lowest levels of the past eight years. GM traditionally accounts for 16% to 18% of the entire U.S.-based warranty industry all by itself, so its success at cutting warranty costs has had a noticeable effect on the overall totals and averages.
In the first quarter of 2010, GM set aside less than two percent of its automotive revenue as warranty accruals -- the first time since at least 2003 that it's ever dropped that low. Ford Motor Co. pierced that level in 2008; Navistar was below it for all of 2008 and 2009; and Caterpillar broke below a 2% accrual rate earlier this year. So there's good news all around the vehicle-making industry -- not just with passenger cars.
Change in Estimates
There is a slight bit of estimation in the figures below. Because annual reports have a later deadline than quarterly reports, and because we're only about seven weeks into the fourth quarter, companies such as Oshkosh Corp., which ended its fiscal year on September 30, have yet to file their latest financial statements with the U.S. Securities and Exchange Commission. Therefore, we have added placeholding estimates for these companies into the industry totals.
Also, in certain cases, when claims and accrual rates suddenly jumped or dove to unusual levels at the end of a given company's fiscal year, we recomputed the totals and averages for just their fourth fiscal quarter rather than flattening them out over the entire 12 months. This has the effect of increasing the apparent volatility of a given trend line, just as the use of 12-month averages have a habit of disguising that volatility.
Even with those additions and changes, however, the total amount of claims reported by automotive OEMs declined by about 10% during the first nine months of 2010, from $6.74 billion in 2009 to $6.08 billion in the same period this year. Auto parts suppliers, which we shall examine in depth next week, saw their own 11% decline in claims, so it wasn't simply a matter of shifting warranty costs from OEMs to suppliers. Although that's a major factor from the point of view of the parts suppliers, it's a minor factor for the OEMs.
Sales Are Way Up
The 2010 decline also wasn't a matter of falling sales. Plain and simple, sales are no longer falling. As best we can tell, the product revenues of the automotive OEMs are up about 26% in 2010 from the same time last year, with General Motors, Paccar, Oshkosh, Thor Industries, and Polaris Industries among those reporting even higher rates of sales growth than the industry average. Only five OEMs saw declining sales in the latest quarter.
What this claims decline could be is the last gasp of the recession: the lagging hangover from the 2008 and 2009 model years, in which relatively fewer vehicles were sold. There's a lag time between when a vehicle is sold and when it needs to be fixed, of course. And since there's now fewer two- and three-year-old vehicles to be fixed, the claims totals are down in 2010.
Figure 1
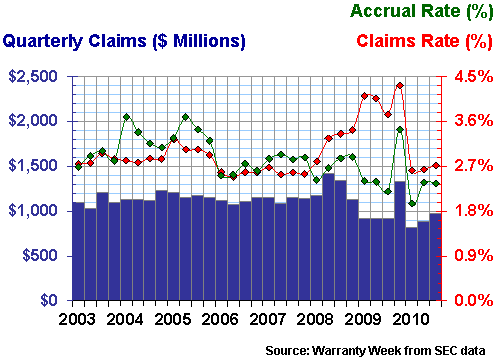
Automotive OEM Warranty Claims Paid, 2003-2010
(in US $ millions per quarter)
Claims peaked for the automotive OEMs right at the end of 2007, when they paid out $3.09 million in claims. That capped a record year in which some 36 U.S.-based auto OEMs together reported $11.33 billion in claims. In contrast, at $9.31 billion, last year was the smallest total on record. But as mentioned, we're now 10% below that pace with only one quarter's data left to report.
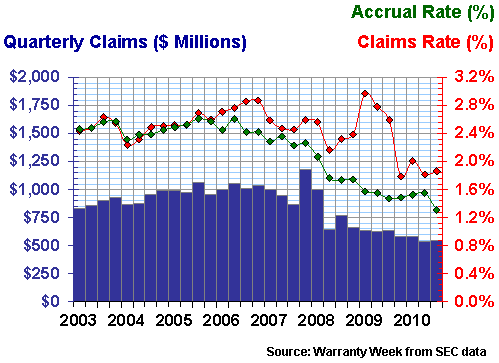
In Figure 2, the effect of the recession on warranty costs is even more obvious. The only three quarters in which auto OEMs accrued less than $1.5 billion per quarter were all in 2009. Comparing the first nine months of this and last year, accruals in this sector are up a staggering 24% in 2010, from $4.17 billion to $5.15 billion. But then again, sales are up 26%, so that's really no surprise.
Figure 2
Automotive OEM Warranty Accruals Made, 2003-2010
(in US $ millions per quarter)
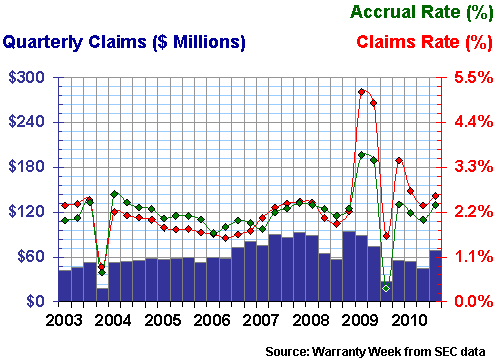
Those are the outlays in terms of dollars. In Figure 3, we've charted the claims and accrual rates as a percentage of product sales. And because product sales fell so fast and so far in 2008 and 2009, there's a bit of a spike in the industry's claims rate during those recessionary years.
Simply put, claims didn't fall as fast as sales, because of the lag time between when a vehicle is sold and when it needs warranty work. Therefore, the ratio between claims and sales shot up, from the 2.5% range that it occupied in 2003-2007 to as high as 3.3% in early 2009.
Figure 3
Automotive OEM Warranty Claims & Accrual Rates, 2003-2010
(as a percentage of product revenue)
At the same time, the industry's average accrual rate continued to fall right through the recession, except for that one weak spike late in 2009. This, we think, is a little bit of cost-shifting to suppliers, and a lot of increase in product reliability. Next week we'll try and quantify the OEM-supplier transfer, but this week let's celebrate the reliability boost.
As was mentioned, GM really sets the pace in the auto OEM sector. So it's no surprise to see a 2009 spike in the company's claims cost. In 2008, GM sold $147.7 billion worth of vehicles and paid $5.07 billion in claims. In 2009, sales fell 30% but warranty costs fell only 19%. So of course the percentage rate shot up.
Figure 4
General Motors Co.
Warranty Claims & Accrual Rates, 2003-2010
(as a percentage of product revenue)
The good news is that in 2010 the claims rate has gone back into the "normal" range, while the accrual rate set a new low earlier this year. The bad news is that GM has allowed its warranty reserve to fall to a level where it can cover only 21 months' worth of claims, which is the thinnest it's been since shortly before its bankruptcy filing.
In other words, perhaps the reason the company needed the U.S. government to guarantee its warranties in 2009 was because it hadn't set aside enough on its own? After all, it stands to reason that if you're setting aside enough accruals at the time a product is sold to cover its warranty costs for upwards of 36 months, that your warranty reserve would exceed 36 months of coverage.
Ford Continues to Cut Costs
Ford, meanwhile, saw its accrual rate dip below 1.5% for the first time last year. Now it's down to 1.3%. Its claims rate nearly touched three percent in early 2009. Now it's down below 1.9%. Is that also below the true cost? or has Ford reduced its costs to a new low level?
In Figure 5, it appears that Ford is enjoying the fifth year of significant warranty cost reduction. Except for the recession-induced spike of 2009, the trend lines have been down since late 2005. However, Ford's current warranty reserve balance now equals only 15 months of claims cost. So perhaps it's been cutting accruals too aggressively?
Figure 5
Ford Motor Co.
Warranty Claims & Accrual Rates, 2003-2010
(as a percentage of product revenue)
Some of that cost reduction has come from the sell-off of warranty-intensive divisions such as Jaguar Land Rover. But most of it has come from internal efforts to raise product reliability and lower warranty costs. And time will tell. Ford's accrual rates have been below two percent for 10 quarters. Claims have been there for four quarters. So let's see where things stand at the end of 2011.
Tracking the Top Five OEMs
Now comes the dangerous part. We don't want to compare companies directly, but we still want to put them on the same chart. And that inevitably leads to comparisons.
Below is a chart that tracks the top five passenger car makers in the U.S., although Chrysler hasn't been part of the data since the dissolution of DaimlerChrysler. Hopefully, Chrysler will soon follow GM with its own spectacular IPO, and will fill in the blanks for 2007-2010.
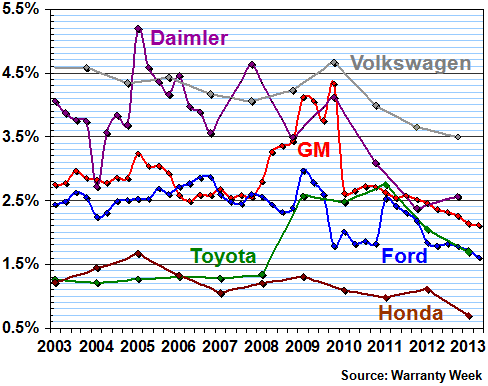
The most important aspect of Figure 6 is the trend over time. As the chart illustrates, in late 2009 Ford saw its claims rate drop below Toyota's, while GM saw its claims rate rise above Daimler's. In 2010, however, GM has dropped back down while Ford has remained about the same. And until 2008, Ford and GM were about the same.
It probably doesn't mean much, and is likely to be explained by accounting differences, sales trends, currency differences and numerous other factors. But even if we just compare each company against itself over time, it's clear that GM and Ford are both making some major progress this year.
Figure 6
Top Five Automotive OEMs
Warranty Claims Rates, 2003-2010
(as a percentage of product revenue)
Since the sale of Chrysler to Cerberus Capital Management in 2007, Daimler has provided only annual warranty data, and only for itself. So in Figure 6 you'll see data points for the end of 2006, 2007, 2008 and 2009, but nothing in between. Meanwhile, Toyota and Honda also provide only annual data, but their fiscal years end on March 31. So their data points are shifted to the first quarter of each respective year. And Chrysler has provided no warranty data of its own since 2007, except for occasional cost reduction estimates.
It is dangerous to compare one company against another directly, without knowing how they might count warranty costs differently. For instance, one company might count the retail price of parts while another might count their replacement cost. And one might include the cost of recalls along with warranty, while another might count them separately.
In other words, while it appears that the Japanese manufacturers have lower warranty costs than the Americans, and that the Americans have lower costs than the Europeans (we also have data for VW, BMW and other OEMs that are not on the chart, but which support this assertion), we can't say it correlates exactly to trends in product reliability or quality. But there is a correlation between falling warranty costs and increased reliability. And Figure 6 helps explain a whole lot of recent industry news.
Trucks and Buses Too
There's more to the industry than just passenger cars, of course. There is a whole array of vocational vehicles, not only large on-highway trucks and delivery vehicles but also small motorcycles and sports equipment. And there are buses and recreational vehicles and all sorts of lawn, garden, farm, and construction machinery.
We've covered the off-road segment pretty thoroughly in other newsletters, so this week we'll spotlight two leading large vehicle manufacturers and one leading small vehicle maker. In Figure 7, we're tracking Navistar International, which is actually now a manufacturer of not only trucks and buses, but also recreational vehicles.
Navistar also makes diesel engines, and for years this was a source of friction with Ford Motor Co. It also threw off Navistar's warranty charts, because the company adopted a strategy of waiting for the outcome of the lawsuits rather than making regular accruals.
Now, however, that issue has been settled, and so lately the company's accrual rate has risen back up to the "normal" range of two percent. However, Navistar's claims rate has remained above 2.4% for more than five years. So of course the company's warranty reserve has shrank, down below 20 months in 2009 and 2010 from as high as 30 months in 2007.
Figure 7
Navistar International Corp.
Warranty Claims & Accrual Rates, 2003-2010
(as a percentage of product revenue)
At Paccar, claims and accrual rates have tracked each other very closely, as evidenced by the close proximity of the red and green lines in Figure 8. Except for some recession-induced volatility in 2009, the company has managed its warranty accounting rather predictably for the past eight years.
Figure 8
Paccar Inc.
Warranty Claims & Accrual Rates, 2003-2010
(as a percentage of product revenue)
If we set aside the four quarters of 2009, and if we ignore that one anomaly in the fourth quarter of 2003, then Paccar's claims rate has never been above 2.7% nor below 1.5%. Its accrual rate has remained within an even tighter range: 1.7% to 2.6%. And, of course, the lines have remained very close together, so the warranty reserve remained about the same relative size.
Motorcycle Warranties
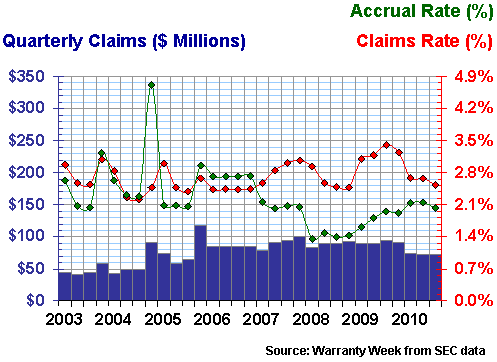
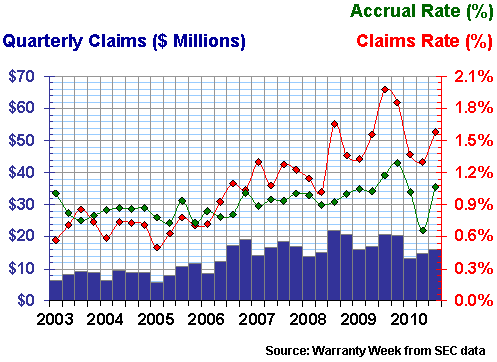
Finally, at Harley-Davidson, it's once again the same story. Like Paccar, Ford and GM, things got a little out of control in 2009, but they're returning to "normal" now. And like GM and Ford, the company has recently reduced accruals to a record-setting low level.
Figure 9
Harley-Davidson Inc.
Warranty Claims & Accrual Rates, 2003-2010
(as a percentage of product revenue)
In the second quarter of 2010, Harley reported motorcycle sales of $1.135 billion, claims of $14.8 million, and accruals of only $7.45 million. That translates into a claims rate of 1.3% and an accrual rate of only 0.7%.
Has the company snapped a multi-year trend of rising warranty costs? The direction has been mainly upwards since 2005. And while the third quarter figures were both up, they're below the trend. However, sales were down in the first and third quarters, which suggests that the recovery hasn't been all that robust at this end of the market.
Falling Claims Totals
Bottom line, we've recorded just over six billion dollars worth of claims by automotive OEMs in the first nine months of 2010. Their U.S.-based suppliers have reported an additional $1.26 billion in claims during the same period. Next week, we'll take a deeper dive into the parts suppliers, and into the increased costs they're seeing thanks to the efforts of their OEMs to push warranty costs their way.
But unless something changes drastically during the fourth quarter, we're likely to see an annual industry claims total below $10 billion for the first time since mandatory reporting began in 2003. And with increasing sales at the bottom of the claims and accrual rate fractions, we're likely to see even more record lows in the months ahead.
Product Warranty Series
This is the eighth in a series of 11 industry-by-industry newsletters that examine product warranty claims and accrual trends in detail over the past eight years. Links to the others in the series are included below, in case you've missed any.
September 16: Computer Warranty Claims & Accruals
September 23: Data Storage Warranties
October 7: HVAC & Appliance Warranties
October 14: New Home Builders & RV Maker Warranties
October 21: Construction Equipment Warranties
November 5: Aerospace Warranties
November 11: Security Equipment Warranties
November 18: Automotive OEM Warranties
December 2: Automotive Supplier Warranties
December 16: Medical & Scientific Equipment Warranties
December 23: Telecom Equipment Warranties
| 


