Editor's Note: This column by Christopher W. Hurst and Jose Moreno Codina of
Towers Perrin is the latest in an ongoing series of contributed editorial columns. Readers
who are interested in authoring a contributed column in the future can click here to see
the Guidelines for Editorial Submissions page.
Price Optimization:A Potent Weapon for the Warranty Industry.
By Christopher W. Hurst and Jose Moreno Codina, Towers Perrin
The hotel industry has long taken advantage of flexible pricing, based on demand, the type of customer, the day of the week and the season. If you make a reservation at a popular resort hotel at the height of the season, you'll certainly pay top dollar. Conversely, many city hotels that rely on business travelers during the week offer cheap weekend rates to attract guests and fill rooms on Saturday nights. This is "price optimization" -- the integration of demand-side pricing (a customer's willingness to pay) into an overall pricing strategy.
Traditionally, many in the warranty industry have priced their goods and services based on supply-side factors (production cost plus a margin for profit). However, this cost-plus-profit approach leaves a lot of money on the table in the form of lost revenue from prospective customers. According to AMR Research, between 1% and 5% of value is lost across all industries because companies don't know enough about their customers' willingness to pay or don't have the ability to profit from this knowledge.
Pricing can be one of the most potent weapon companies have. When a more sophisticated pricing approach is implemented, operating profit increases significantly, much more than when other factors such as variable cost, volumes or fixed costs are adjusted. In a few industries where the product's value is largely intangible (e.g., cosmetics), prices have always been largely based on demand. However, it is only in recent years, with the development of sophisticated predictive modeling capabilities, that a broader spectrum of industries has started to pay attention to the demand side.
Among other obstacles, understanding how customers respond to price changes is fiendishly difficult. And until recently the data crunching and econometric modeling capabilities it demands simply haven't been widely available. But now, demand-side pricing techniques have begun to spread from the industries that originated these practices -- hotels and airlines -- to other industries, such as retail, automotive, telecommunications and financial services.
The aim of price optimization is to set prices across an insurer's portfolio in a way that maximizes a predefined measure of customer value over a given time period and aligns pricing with the company's strategic objectives. Effective price optimization allows a warranty provider to increase and decrease premium prices based on a combination of marketplace variables, including (but not limited to) product demand, certain customer characteristics and the competitive landscape. It also takes into account the implications of price differentials, including profitability and lifetime value.
Parker Hannifin Case Study
An illustrative case is Parker Hannifin Corp., a leading producer of industrial parts used in aerospace, transportation and manufacturing. Throughout most of its history, Parker Hannifin priced the 800,000-plus products it sold using a simple cost-plus pricing model.
In 2001, new management concluded that a new pricing strategy was the key to improving margins. Managers observed that, under the current pricing system, efforts to improve a product or reduce production costs did not necessarily result in higher margins. Prices for the improved product had the same margin as the standard product, because reduced production costs were routinely passed on to customers through lower prices.
As a result, Parker implemented a new pricing strategy that factored customer demand and levels of competition into the price for each product. The effort was a resounding success: The company's return on invested capital went from 7% in 2002 to 21% in 2006!
Three Building Blocks of Price Optimization
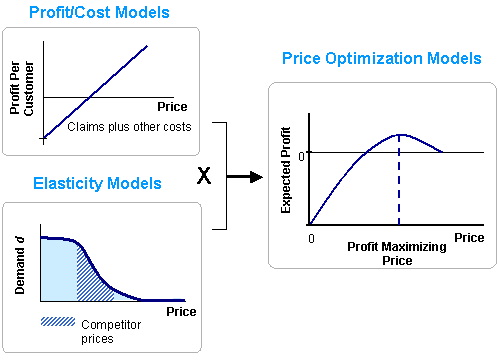
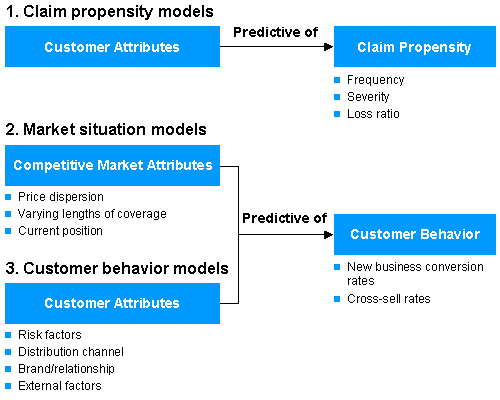
In essence, price optimization is about getting to know your customers and your market better. As can be seen in Exhibit 1, there are three constituent parts of a comprehensive price optimization program, each of which is a value-adding activity in and of itself:
- Claim propensity models express how customer attributes are predictive of their inclination to report a claim. These models are used to develop new rating variables or increase the accuracy of existing rating variables.
- Market situation models express how the company's competitive position and the market's competitive intensity vary by segment or niche within the market. As discussed further below, the relative value and importance of these market situation models within the warranty industry can vary by market and entity.
- Customer behavior models express how the customer's attributes and the market's situation are predictive of the customer's behavior (e.g., response rate or cancellation rate).
Exhibit 1
Price Optimization Balances the Trade-Off between Supply/Cost and Demand/Revenue
In this example, we integrate profit (cost) models by customer segment and distribution channel with price elasticity models. The goal is to set prices that optimize the trade-off between the contribution per policy and volume of business expected to meet a given financial objective and business constraints.
All three of these modeling techniques are essential building blocks of price optimization (Exhibit 2).
Exhibit 2
Three Types of Predictive Models
Support Price Optimization
Price optimization integrates claim propensity, market situation and customer behavior models to predict the impact of price changes on volume and to identify the best price changes for a given financial objective and constraints. The goal is to provide a company with the tools necessary to reach a particular strategic objective (e.g., volume or profitability) and to allow for flexibility to adapt to changing business circumstances.
The power of price optimization is that it allows the company to gather demographic and market data and use them, singly or in combination, to set rates. These data range from variables that help predict prospective losses (e.g., credit score and loan-to-value ratios), to competitor pricing, to customer likelihood to purchase a warranty at specific times of the day. In fact, the list is limited only by the company's needs.
Claim Propensity Models
The traditional focus of many companies has been to seek advantage by using available data to better select or reject risks and price them. Sophisticated claim propensity models can integrate qualitative customer and product attributes with traditional quantitative rating risk factors. The results allow more accurate prediction of both the likelihood that a policyholder may experience a claim in the future and the probability of the claim being above or below average claim costs for any given class. These models can be used for targeted marketing, underwriting segmentation and more accurate pricing.
Companies face several issues in moving to a greater use of more accurate risk assessment and pricing. First is the challenge of gathering accurate data and scrubbing them so they're useful. Second is conducting statistical analyses and extracting usable insights from them. Finally, more accurate risk assessment and pricing entails a fundamental shift in a company's culture.
Claim propensity models almost always reveal some surprising, nonintuitive results that challenge long-held beliefs, and the company's staff must learn to trust the data that come out of them. By definition, new risk assessment models are not consistent with market practice. Implementing claim propensity models is expensive, and if the staff ignores the results or the company doesn't act on them, it will make no sense to incur the costs.
Market Situation Models
Many companies analyze the price competitiveness of their products based on a small sample of representative hypothetical customers by comparing their prices against key competitors. While this approach gives the company a general sense of its relative price position, insights from such an analysis are limited by the small sample size. Innovative companies have significantly expanded the extent of these price comparisons and found new ways to make use of the richer market information they provide.
By populating a market situation model with price comparisons for virtually every possible customer (i.e., every combination of customer attributes) across a broader array of competitors, companies can identify customer population segments and niches where their competitive position is weak or strong. More importantly, the large volumes of price comparisons facilitate a more complete analysis of the competitive intensity of particular market segments.
This analysis, in turn, enables the company to make tactical decisions about which segments to attack and which segments to retreat from. Competitive market analysis using market situation models is used:
- to help identify segments where the company's prices are low or high relative to the market;
- to understand the competitive intensity in each segment and support strategic decisions regarding product deployment in different competitive segments; and
- to understand the potential scope for price changes and what impact such changes would have on market positioning.
In certain warranty industries (such as the vehicle service contract industry), a warranty product is often sold exclusively through dealerships. In other cases, the product is sold direct to the consumer. For dealer-sold contracts, there may be less value attributed to the actual price of a particular contract since many consumers don't obtain multiple price quotes. However, the relative competitiveness of a vendor's warranty product may still help predict what the customer is willing to pay for the contract.
In some cases, competitor prices for warranties may not be as easy to obtain as they might be for other industries. Depending on the product, price information may be found through internet searches, dealership and general agent assistance, or even competitors' rate filings with state departments of insurance. However, if the information isn't available, a simpler competitive index can be based on only the terms and coverages of warranties on similar products offered by selected competitors. For instance, it's likely that the terms for some product warranties (e.g., length of coverage, waiting period) and details of what types of losses are covered by competitors can predict the likelihood of a prospective customer purchasing your product.
Customer Behavior Models
Developing accurate customer behavior models is the final building block in price optimization. By developing models of customer responses to marketing campaigns, competitive activity and other pricing or service events, companies can gain a comprehensive picture of customers' demand preferences at different price points and understand how they will affect new business development. Because this analysis enters new territory for most companies, it will likely require a shift in mindset on the part of management, followed by careful project planning to be sure the analysis results will be usable.
The price elasticity function takes into account different variables that have not been widely analyzed, including the history of price variations, brand strength and awareness, distribution channel and other significant factors. The result of this modeling produces a scoring algorithm to predict conversion rates for price relative to price changes and, if applicable, to the competition.
The most effective way to generate a price elasticity of demand curve is to vary prices and measure the impact on volume. Insurers can use controlled testing of rates to generate demand curves. By replicating the rate structure and marketing to one group of customers through parallel testing of multiple sets of rates, they can measure the impact on volumes as prices change. This kind of testing helps measure conversion and retention rates by price.
Where parallel controlled testing is not appropriate, multivariate techniques drawn from historical data can be used to develop models explaining the likelihood of retention as a function of price change and customer characteristics. Models may also include competitors' prices.
Bringing It All Together
The final step and culmination of this work is to develop a new pricing structure that optimizes profit per customer. In other words, it maximizes profitability subject to a minimum volume of business. A company's preference for market share over short-term profitability will shift over time. It may decide to aggressively increase market share when the market is strong in order to benefit from a hardening. Alternatively, when facing capacity constraints, a company may wish to focus only on its most profitable customers.
Using price optimization techniques, a company can leverage sophisticated analytical methods to clarify strategic direction in pricing strategy and react quickly and nimbly to new patterns in data as they are uncovered. By integrating the three components of price optimization -- claim propensity models, market situation models and customer behavior models -- companies can more confidently meet particular profit objectives or change prices to meet market share targets, while understanding the profit implications of doing so.
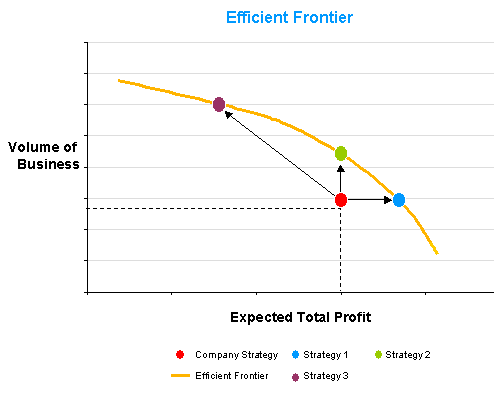
Our objective is to move a company closer to the "efficient frontier" that represents maximum profit for each particular volume of business (Exhibit 3).
Exhibit 3
Efficient Frontier of Portfolio Profitability
Given the complexity of different analyses, price optimization is typically undertaken in phases by iteratively testing price changes against volumes and profitability. Testing is first performed across a small part of the portfolio and is then expanded to more markets and lines of business. The advantage of a phased approach is that it can be used to prove the concept, and tactics can be adjusted according to results. The outcome of each step can help demonstrate impact in order to gain further organizational buy-in, and the information collected during the first phases can be used to provide input to later phases.
Initially, price testing can be used to make iterative improvements to profitability. In later stages, we combine multivariate models of costs and price elasticity to simulate the relationship between price change at the customer level and overall profitability. Findings can be used to set prices across the whole portfolio.
Developing price-testing capabilities can help your company move to more textured and accurate representations of your market. But there is hard work involved. For each step to be valuable, you'll need solid data, sophisticated statistical models, competitive intelligence, and courage and conviction.
A Word About Auto Warranties
For many in the auto warranty industry (and perhaps in some specific cases in other warranty industries), selling primarily through auto dealerships (or other third parties who contribute to the final charged premium) presents a unique challenge to price optimization because the insurer or administrator has limited control over the final price (given the mark-up applied at the dealership level). In these cases, it becomes critical for the warranty administrator/insurer to establish processes for working directly with the dealerships to design a price optimization approach that adds value for all parties.
In these cases, price optimization models can be designed to maximize profits for the dealership and the administrator/insurer -- or at least achieve a balance between the goals of each party. And in cases where the dealership shares in the ultimate profitability of their dealer-sold vehicle service contracts (through individually owned reinsurance companies), the dealership has even greater vested interest in the ultimate profitability of the product.
Once a company has a picture of customer preferences and is armed with an understanding of how various pricing actions will impact purchasing decisions, it can apply that understanding to other components of the pricing strategy developed earlier in the process.
Achieving various levels of price optimization is a journey. We recommend that companies interested in raising their game start by understanding where they stand relative to their competitors, then determine the best way to improve their modeling and analyses. What methodologies, benchmarks or analyses may be missing from your current approach that could help you achieve greater profitability? With this knowledge, you can decide how to move forward.
About the Author:
 Christopher W. Hurst is a consultant with Towers Perrin and is located in the firm's St. Louis office. He specializes in reserving and pricing for warranty, GAP and other F&I products for various entities (manufacturers, third party administrators, insurers, and reinsurers) and types of products (vehicles, homes, heaters, and air conditioners).
Mr. Hurst�s warranty experience includes a range of services for clients, including performing liability valuations of warranty obligors; forecasting unpaid liabilities (both a point estimate and a range of possible outcomes), unearned premiums and indicated rates; conducting funding studies for catastrophic stop-loss reinsurance protection for vehicle service contract providers; developing estimated losses (and the resulting necessary funding) for new products; completing year-end reserve reviews (including a Statement of Actuarial Opinion) for warranty and other long-duration contract insurers; and providing expert witness support. Mr. Hurst is a graduate of Northwestern University, a Fellow of the Casualty Actuarial Society, and a Member of the American Academy of Actuaries.
For comments or questions about this article, please feel free to call or e-mail Mr. Hurst at +1 (314) 719-5846 or chris.hurst@towersperrin.com.
| 


