Telecom & Medical Equipment Warranties:While Motorola sets the pace in the telecom equipment warranty sector, no one company dominates medical equipment warranties. In fact, if anything, the medical and scientific instrument makers are known for consistently low rates of warranty spending.
Is it the second quarter already? There's still a huge pile of fourth quarter 2008 data to rummage through, with this week it being the turn of both telecom equipment and medical & scientific instrument manufacturers to go under the microscope.
In this newsletter, we're examining the past six years of warranty expenses as reported by some 329 U.S.-based makers of the high-tech equipment used by telecom network providers, doctors, hospitals, and laboratories. However, only 171 of the companies are still in business; the balance were either acquired, taken private, or ceased operations.
That is a sobering statistic for anyone looking after American manufacturing policy: nearly half the makers of telecom and medical gear that began reporting their warranty expenses in 2003 no longer were in a position to do so by the end of 2008. And, as bad as things are in all industry sectors, it's a rate of attrition that was high long before the recession officially began.
We last looked at the medical & scientific industry in the October 2, 2008 newsletter, with a look at the telecom industry following in the October 9 newsletter. In both instances, we provided a series of eight snapshots of some of the industry players. In this newsletter, we'll do that again, trying not to duplicate any of the companies and also leading off with a six-year chart for the entire industry segment.
We'd like the statistics to tell a story, but in some cases the data can mislead. Let's start with the telecom equipment industry, where the reasons why the statistics can so easily tell a misleading story is easiest to see.
The Telecom Recession?
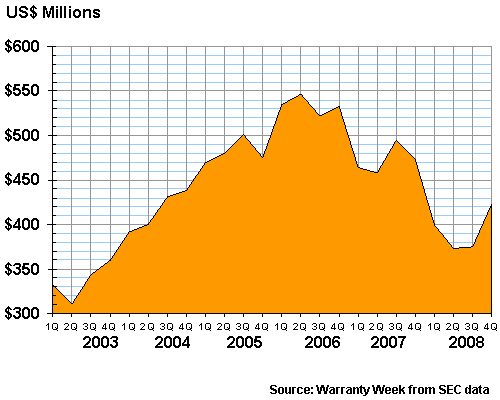
In Figure 1 below, it looks as if warranty claims peaked at a level of $547 million in the middle of 2006, and have been declining steadily ever since. That is, except for the end of 2008, when claims unexpectedly turned upwards again, jumping from $375 million in the third quarter to $423 million in the fourth quarter.
Figure 1
Telecom Equipment Warranty Claims
Worldwide Warranty Claims of U.S.-based Companies, 2003-2008
(claims paid in US$ billions)
Such a chart would be a great support for anyone who wanted to document the beginning and the bottom of the current recession. It has everything that's needed: the peak, the valley, and the tiny upturn signifying hope for the future.
However, it doesn't tell the whole story. Of the 82 currently operating telecom warranty providers, only Motorola and Cisco Systems are paying out more than $200 million a year in claims, and only six others are large enough to make the list of the top 100 warranty providers.
Motorola Sets the Pace
Like General Motors or Ford in the automotive sector, or HP and Dell in the computer sector, Motorola and Cisco are large enough to sway the industry total all on their own. And although Cisco is rather steady and predictable when it comes to warranty expenses, Motorola is just the opposite.
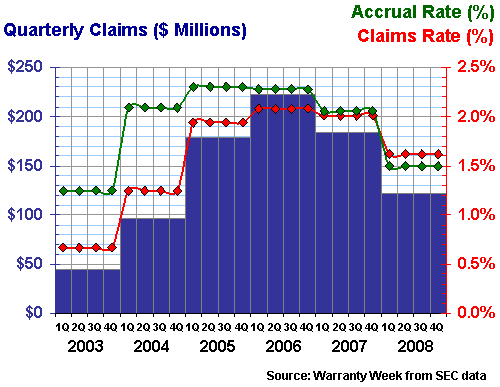
Motorola announces its warranty claims and accrual totals only once a year, at the end of each year. This makes it more difficult to analyze its warranty expenses on a quarterly schedule, but it's still possible. In Figure 2 below, what we've done is taken the annual expense and chopped it into four equal pieces. While it's unlikely that the company spent precisely the same amount in each of a given year's four quarters, this method at least approximates the true figures.
Figure 2
Motorola Inc.
Warranty Claims & Accrual Rates, 2003-2008
(as a percentage of product sales)
It looks like Motorola is having its own peaks and valleys, at approximately the same moment as the wider telecom industry. But because the Motorola data is in four equal slices, no upturn is evident in the fourth quarter data.
Figure 1 (and Figure 5 below) has its vertical axis stretched as far as possible in order to highlight the quarterly fluctuations as much as possible. The other charts do not have their axes stretched. Still, it does appear that at times, Motorola accounts for almost half the whole industry's warranty spending.
Indeed, as major players of the past such as Lucent technologies, Avaya, and Scientific-Atlanta were acquired or taken private, and as Motorola's own warranty spending continued to grow, its share of the industry total did at times approach half. Its $178 million outlay for claims in 2003 was only 13% of the industry total. Its 2005 share was almost triple that (37%). And the $891 million reported in 2006 claims was almost 42% of the industry total.
And then, as Motorola's warranty claims began to decline, so did the industry's. Motorola's 2007 total was $735 million while the industry's total was $1.89 billion that year. And then in 2008 Motorola's total was $488 million while the industry's total was $1.57 billion.
Last year, therefore, the telecom equipment sector spent $318 million less on claims than it did in 2007. But $247 million, or more than three-quarters of that reduction, was Motorola's alone. So that's why the shape of Figure 1 can be misinterpreted. While it can be taken to show the changes across an entire industry, it mostly shows the changes within just that industry's largest current player.
Nortel Files for Bankruptcy
Speaking of changes, on January 14, Nortel Networks filed in both the U.S. and in Canada for bankruptcy protection from its creditors while it restructures. If that restructuring effort includes a merger with a stronger and presumably a non-North American partner, the industry will lose yet another major player, as it did when the French company Alcatel merged with Lucent in 2006.
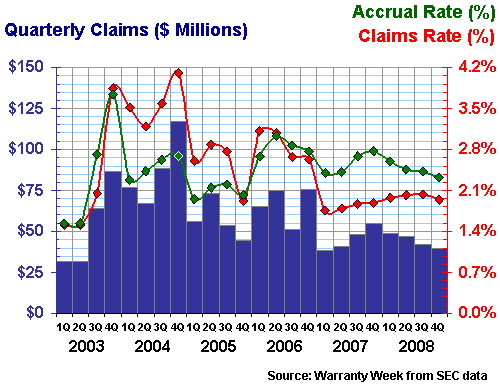
In Figure 3 below, the good news is that warranty expenses at Nortel have been rather boring and predictable for the past two years. That comes as a welcome respite from a much more chaotic period from 2003 to 2006, years in which Nortel was forced to restate its warranty expenses as they jumped from very low to very high rates.
In contrast, during 2007 and 2008, Nortel's claims rate remained within a narrow range of 1.8% to 2.0%, while accruals stayed in the 2.3% to 2.8% range. It was as if Nortel had finally mastered the art of warranty, just in time for the recession to sideswipe the rest of the company.
Figure 3
Nortel Networks Corp.
Warranty Claims & Accrual Rates, 2003-2008
(as a percentage of product sales)
In previous years, Nortel's claims and accrual rates had been as low as 1.5% and as high as 4.1%. That's both lower and higher than is typical for telecom equipment suppliers that specialize in sales to carriers, as Nortel does. For instance, back in the day, Lucent Technologies reported a 1.9% claims rate in its last full year as an independent company.
The truth is that most of the telecom warranty providers are small and medium-sized companies that specialize in one segment of the market or another. Some make data communications equipment. Others specialize in wireless, or perhaps in some even narrower segment such as microwave or television broadcasting. In Figure 4, we're spotlighting a company that specializes in the manufacture of the telephone headsets worn by call center agents and others who must be on the phone for long periods of time each day.
Telephone Headset Warranties
Based in Santa Cruz, California, Plantronics operates worldwide, through distributors in places as far-flung as Ghana, Ecuador, and Nepal. Around 60% of the business is in the U.S., however. And although most of the company's business is in the provision of headsets to the professional call center market, Plantronics also has a presence in the consumer entertainment and mobile phone ends of the market.
In Figure 4 below, some of that diversity can be seen in the sudden ups and downs that typically follow a new product launch. In that respect, 2007 and 2008 have been very active, while 2005 and 2006 were not. And while claims and accrual rates have risen as high as 3.3% and fallen as low as 0.9%, the long-term average has remained within the 1.6% to 2.8% range.
Figure 4
Plantronics Inc.
Warranty Claims & Accrual Rates, 2003-2008
(as a percentage of product sales)
Ciena Corp. is one of those companies whose name always seems to get mentioned in the NASDAQ stock market reports but whose reason for being there is never quite fully explained. At its core, Ciena is a optical multiplexing company whose 1997 initial public offering was the biggest IPO up until that date. And then a decade ago, its bestselling multiplexing products helped the telephone companies wedge so much traffic onto their fiber-optic lines that it became feasible for them to stop billing their best customers by the minute. But then the post-Y2K recession hit, and carrier equipment sales plunged.
Instead of merely trying to ride out the post-Y2K recession, Ciena decided to diversify, and began buying up smaller companies engaged in corporate networking activities and more mainstream computer networking activities such as data storage. What's remarkable about the company from a warranty perspective is how all these acquisitions seem to have come together so well during the past six years.
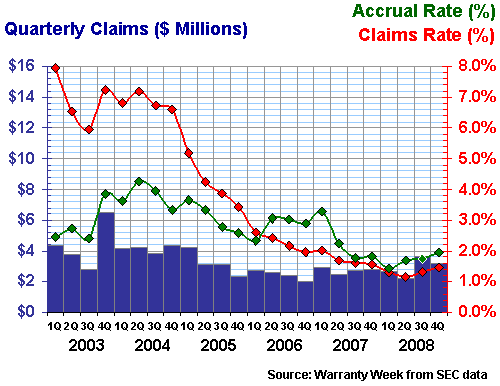
In Figure 5 below, Ciena begins 2003 with a dangerously high 8% claims rate and a dangerously mismatched 2.4% accrual rate. But then in 2005 the claims rate begins to fall, and by mid-2006 it was actually below the accrual rate. By the end of 2008, the claims rate was at 1.5% and the accrual rate was just below 2%. And the six-year chart looked like a Nordic ski jump.
Figure 5
Ciena Corp.
Warranty Claims & Accrual Rates, 2003-2008
(as a percentage of product sales)
Let's switch gears to the medical and scientific equipment industry, where some 93 companies have reported warranty claims in 2008. The big difference from the telecom industry is that there are really no market-dominant players, although five of the companies did manage to get onto the lower half of the top 100 list.
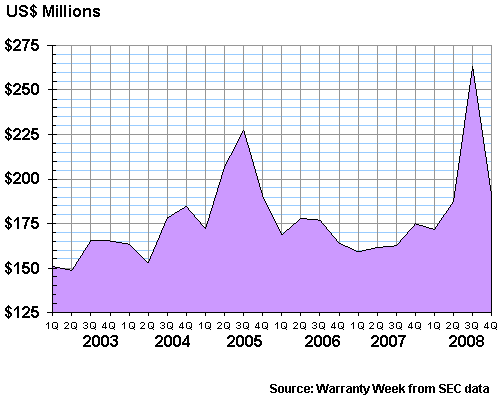
In Figure 6 below, one can see clearly how claims have twice spiked, in the third quarters of both 2005 and 2008. We wish there was a simple explanation, but none of the major players registered sudden increases in claims, at least in 2005. In fact, some such as Varian Medical Systems and Medtronic actually reported declines in their claims levels compared to the second quarter of 2005.
But in 2008, at least, the culprit was clearly Eastman Kodak, which sells a variety of high end medical imaging equipment and which in the third quarter of 2008 saw its claims total suddenly triple to $73 million. One can be forgiven for missing that news -- it has never been reported anywhere. And now it's old news, with Kodak's claims total returning to more appropriate levels in the fourth quarter of 2008.
Figure 6
Medical Equipment & Scientific Instrument Warranty Claims
Worldwide Warranty Claims of U.S.-based Companies, 2003-2008
(claims paid in US$ billions)
Were it not for those twin spikes, warranty claims within the medical and scientific instrument industry would have stayed within the $150 to $200 million per quarter range for 21 of the past 24 quarters. That is an amazing level of consistency, but as we shall see, consistency is a hallmark of many of the major players.
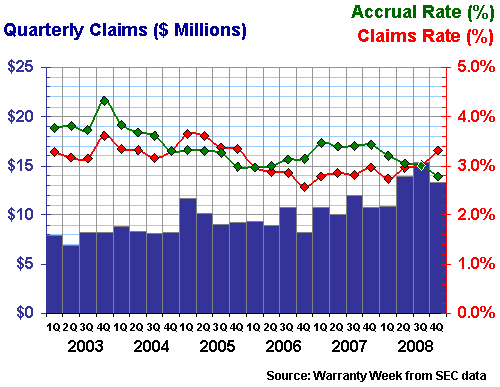
For instance, the six-year warranty track record of Varian Medical Systems is remarkable for its unremarkability. Six years ago, the X-ray imaging company's claims rate was 3.3% and by the end of 2008 it had ... returned to 3.3%. The company's accrual rate was more variable, falling from a 2003 high of 4.3% to a 2008 low of 2.8%. Meanwhile, sales were up 10% so the claims rate fell even as claims in dollars crept up.
Figure 7
Varian Medical Systems Inc.
Warranty Claims & Accrual Rates, 2003-2008
(as a percentage of product sales)
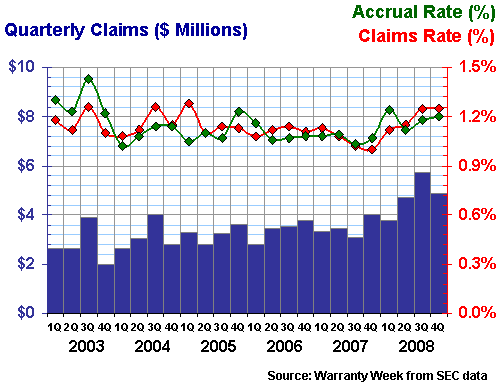
Mettler-Toledo is more on the scientific instrument side of the industry, specializing in lab balances and analytical instruments, though it also is a major provider of grocer's scales, truck scales, and even postage scales. One can almost see how finely balanced the company is in Figure 7, with six years of data extremely close to 1.2%.
Figure 8
Mettler-Toledo International Inc.
Warranty Claims & Accrual Rates, 2003-2008
(as a percentage of product sales)
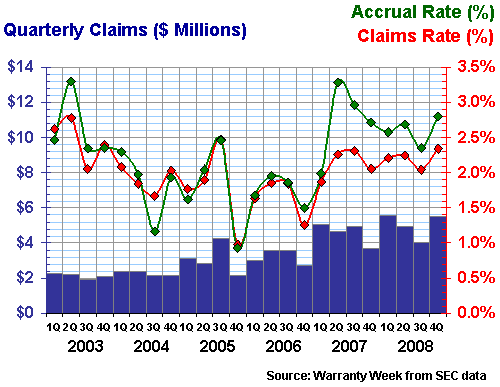
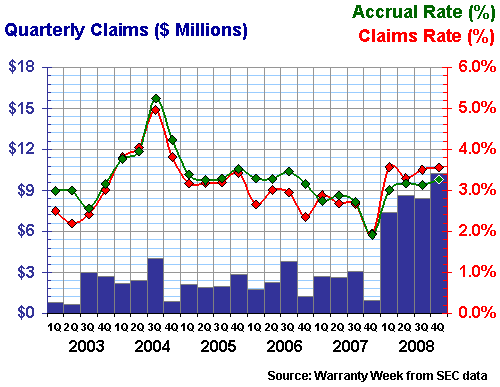
Bruker Corp., makers of MRI and X-ray imaging equipment is one of only three medical or scientific instrument companies to make it onto any of the top ten lists included in the March 13 newsletter. Its claims rate jumped from 2.0% to 3.6% in the past year, and its accrual rate jumped from 1.9% to 3.3%. In addition, its warranty reserve grew from $14 million to $25 million in size.
The reason for all these massive increases, we're happy to report, is an acquisition the company made last year. Bruker BioSpin had been a separate company owned by investors that also had a stake in Bruker Corp. But in February 2008, the similarly-named company merged with Bruker Corp. That in turn helped to double Bruker's annual revenue, and of course to drive up its warranty costs. The good news, as can be seen in Figure 9, is that claims and accruals have remained close to 3% of revenue, even though the claims totals jumped from $2 or $3 million per quarter to $8 or $10 million per quarter. Accruals have followed more or less the same path.
Figure 9
Bruker Corp.
Warranty Claims & Accrual Rates, 2003-2008
(as a percentage of product sales)
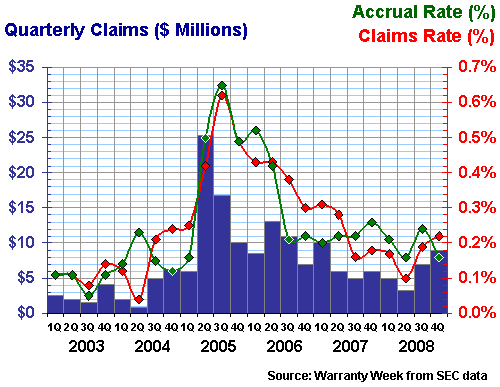
Finally, we wanted to check back in on Medtronic, a company that had quite a scare four years ago when its pacemaker product line was part of a wide-ranging recall. In 2005, Medtronic's claims rate more than doubled while its accrual rate quadrupled. Just in the second quarter of 2005, the company had to put $40.7 million aside in emergency accruals. And then for five of the next six quarters, claims remained above the $10 million mark.
Figure 10
Medtronic Inc.
Warranty Claims & Accrual Rates, 2003-2008
(as a percentage of product sales)
Again, the good news is that whatever ailed Medtronic back then is now firmly in the past. The past two years have been as quiet as 2003 and 2004 were. And with sales increasing at a 16% pace in the second half of 2008, the recent uptick in claims has resulted in a minimal increase in the claims rate, from 0.1% in the second quarter to 0.2% in the fourth quarter. Yes, that's a doubling in six months, but both figures are towards the low end of the scale.
Go to Part One
Go to Part Two
Go to Part Three
This is Part Four
Go to Part Five
Go to Part Six
Go to Part Seven
Go to Part Eight
Go to Part Nine
| 


