New Home Warranties: Is there any correlation between what a company spends on warranty and the satisfaction levels of its customers? For some, fewer claims equals happier customers, but for others, there does seem to be such a thing as not enough warranty.
There's something simple and elegant about the new home industry. When looking at the warranty claims track record of, say, the medical or telecom equipment industry, the underlying trends are partially obscured by several factors. First, many of the manufacturers export, and face competition from importers who are still able to keep their warranty expenditures secret. Second, their revenue streams usually include non-warranted sources such as software, consumables, or services, much of which is not identified.
None of that is a concern in the new home industry. First, imports and exports are not much of a factor, except for the very unusual case of prefabricated homes and recreational vehicles. Most homes are built in place by U.S.-based contractors. Second, while mortgages and land sales are significant sources of revenue for many builders, most identify these non-warranted sources quite specifically.
Also, may we add, that while the medical and scientific equipment industry we spotlighted in the September 13 issue included 140 manufacturers who report warranty expenses, and while the telecom equipment industry includes 120 manufacturers, only 32 new home builders are reporting their warranty claims and accruals to the U.S. Securities and Exchange Commission in their Form 10-Q and 10-K statements.
High Growth in Home Sales and Warranty
For the first half of 2005, the top ten new home warranty providers paid just under three-quarters of the $441.3 million in total warranty claims reported by these 32 builders. This concentration at the top means an analysis of the top ten is a more complete representation of the whole industry. And the absence of imports, exports, or non-warranted revenue means the data is more reliable.
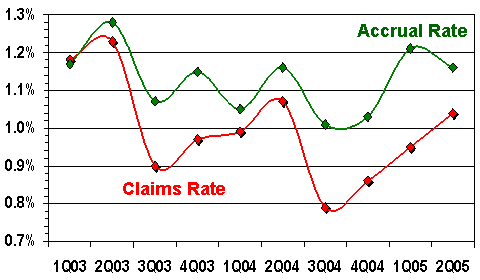
Warranty claims for the 32 new home builders were up an astonishing 26% for the first half of 2005, from $350 million for the like period of 2004. We won't know what the true growth rate is for all manufacturers in all industries until some of the big ones finally file their annual reports, but something in the vicinity of 7% growth is expected. Luckily, total home sales revenue was up by an even higher percentage, because the claims rate -- computed by dividing warranted product revenue into warranty claims -- actually fell from 1.07% as of June 2004 to 1.04% as of June 2005.
The chart below details the claims and accrual rates for new home builders over the ten quarters between the beginning of 2003 and the middle of 2005. As the chart shows, the claims rate has declined in what looks to be a seasonal pattern. The peak of 2003 was 1.23%. The peaks of 2004 and 2005 were significantly lower. In fact, even the valleys -- which both came in the third quarters -- continue to deepen, hitting 0.9% in 2003 and 0.8% in 2004.
Figure 1
New Home Warranty Claims & Accrual Rates
First Quarter 2003 - Second Quarter 2005
 Source: Warranty Week from SEC data
One would expect the new home market to be heavily affected by seasonal factors. However, the downward trend is no doubt also heavily affected by the soaring revenue and skyrocketing average home price. Because these builders are so flush with cash, what they're essentially doing is paying for yesterday's mistakes with tomorrow's money. Their accrual rates, which represent the percentage of current revenue that's put aside to pay future claims, also shows some oscillation but not a constant decrease. It's as if builders know they'll be paying between 1.0% and 1.2% of a new home's pricetag to satisfy all warranty claims, no matter what the home's selling price might be.
The question arises, is there any correlation between the claims rates of these 32 builders and the satisfaction of their customers? In the passenger car industry, for instance, there seems to be something of a disconnect between perceived quality and actual quality of certain brands, but the actual experiences of surveyed owners seems to correlate well with the cost of warranty per vehicle.
In other words, Jaguar is perceived to have very high quality while Buick is perceived low. In terms of actual quality, quite the reverse is true. In fact, low per-vehicle warranty costs allowed General Motors to lengthen Buick's warranties to the four year term commonly found in the luxury sector. And then there's Toyota and Lexus, which are perceived to have high quality, actually do have high quality, and actually do have much lower per-vehicle warranty costs than their American or European competitors.
Customer Satisfaction Data
Is the same thing true in the new home industry? What we need to find is the J.D. Power and Associates of the housing industry. Fortunately, we didn't have to look very far, because just last week J.D. Power and Associates released the results of its 2005 New Home Builder Customer Satisfaction Study.
That survey collected the opinions of 73,353 buyers of newly built single-family homes who provided feedback after living in their homes for periods ranging from four to 18 months. Responses were weighted based on ten different factors. For instance, warranty and customer service received the heaviest weight, of 20%, and quality of workmanship and materials received a weight of 13%. The responses were then organized into 30 different markets, and the top three builders were announced.
Overall, Pulte Homes Inc. and its subsidiaries ranked highest in 16 of the 30 markets, while Centex Corp. and its subsidiaries ranked highest in 10 more. Pulte was second or third in nine more markets. Centex was second or third in 10 more markets. Both companies celebrated their good fortune by issuing press releases. In fact, Pulte issued 16 press releases: one for each of its wins. Other high-ranking notables included KB Home, Lennar Corp., and Beazer Homes USA Inc., who each received a handful of second and/or third place mentions across the 30 markets.
We asked Paula Sonkin, executive director of real estate industries at J.D. Power and Associates whether there was any correlation between this customer satisfaction survey data and the warranty reports of the top builders. She didn't know about the specific warranty records of individual companies, but in general she said the survey was structured so that the results would be heavily influenced by warranty.
"In our survey, the quality of the home is a key driver into why the homeowner might choose the builder to begin with," she said. "The way we look at customer satisfaction, there's two components: performance and expectation. To have high levels of satisfaction, a builder's performance needs to exceed the expectations they set for their customers." All builders say they build quality homes, she said, but this survey measures to what extent customers agree after they've had a chance to live in the home.
Secondly, the survey measures customer satisfaction with problem occurrence and resolution, she said. It's not so bad that there was a warranty claim as it is that the customer perceived the claim to have been mishandled. "Satisfaction declines with the number of attempts to solve a problem," Sonkin noted. "It particularly plummets after one visit. So the best thing for the builder is to do it right the first time."
The survey didn't measure whether homeowners who had problems that were resolved to their satisfaction were happier than those who had no problems. This curious effect, observed in the appliance industry, suggests that buyers expect manufactured products to have problems, but are pleasantly surprised when the repair effort exceeds their expectations. Their satisfaction level rises even higher than those who made no claims, and they are more likely to buy the same brand again than those who had no problems. Conversely, those who had unsatisfactory break-fix experiences are the most likely to switch brands in the future.
In other words, a little warranty expense is a good thing. Done well, it can actually boost customer satisfaction.
New Home Warranty Top Ten
So let's take a look at the actual warranty track records of Pulte, Centex, and eight of their peers. As shown above, the industry average claims rate seems to be around 1% plus or minus 0.2%, while the accrual rate is around 1.1% plus or minus 0.1%. Sixteen of the 20 data points in Figure 1 are within these ranges.
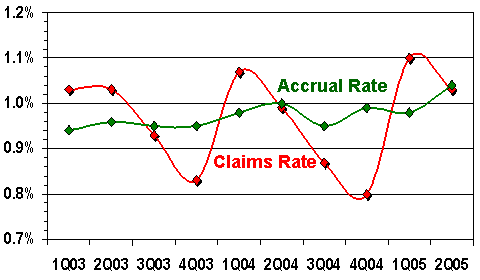
Pulte, as shown below, seems to have a sawtooth wave for a claims rate, with peaks at 1.1% in the winter and troughs of 0.8% in the fall. This seems to be curiously out of phase with the industry as a whole, which has its peaks in the spring and its troughs in the summer.
Figure 2
Pulte Homes Inc.
Warranty Claims & Accrual Rates
First Quarter 2003 - Second Quarter 2005
 Source: Warranty Week from SEC data
Accruals, meanwhile, have remained within a much tighter range for Pulte than for the industry as a whole, with its highest reading coming in at 1.04% and its lowest being 0.94%. Therefore, Pulte seems to be within the average range for claims and slightly below average for accruals. It ended June with just under $84 million in its warranty reserve fund, which was equivalent to the amount of claims it would pay in eight months. In this respect, it was somewhat below the industry average reserve levels, which stood at 14.5 months at the end of June.
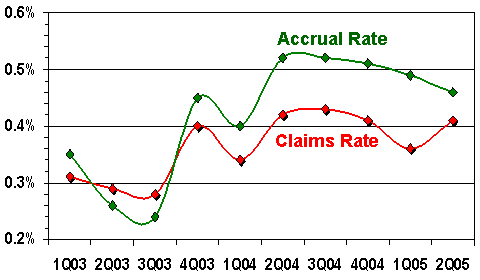
Centex, meanwhile, shows a warranty claims and accrual rate significantly below the industry average, and a reserve level slightly below average. Though Centex has seen its claims rate rise since we last looked at new home warranties in detail in a June 16, 2003 Warranty Week article, it's still close to 0.4% in an industry accustomed to double or triple that rate.
Figure 3
Centex Corp.
Warranty Claims & Accrual Rates
First Quarter 2003 - Second Quarter 2005
 Source: Warranty Week from SEC data
Interestingly, while Centex was fourth behind D.R. Horton, Pulte, and Lennar in terms of homebuilding revenue, it was tenth in terms of warranty claims paid during the first half of 2005. This combination of low claims rates and claims done well seems to have boosted the company above most of its competitors, at least in the latest J.D. Power survey. In the 2004 survey, Centex rated highest in only three of the 30 markets, versus 10 this year.
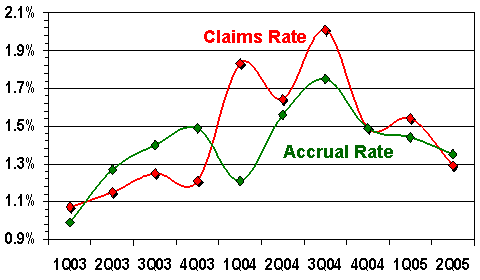
Lennar rated second highest in San Diego, Raleigh, and Tucson, and third highest in Orlando. As the chart below shows, both its claims and accrual rates are above the industry average. That on its own doesn't say much, because Lennar's warranty costs could be higher 1) because it performs a more complete accounting of all warranty costs, direct and indirect, or 2) because it spends more per warranty event to make sure the customer is highly satisfied.
Figure 4
Lennar Corp.
Warranty Claims & Accrual Rates
First Quarter 2003 - Second Quarter 2005
 Source: Warranty Week from SEC data
Even two years ago, Lennar spent the most in terms of dollars on warranty claims, and spent a higher-than-average percentage of homebuilding revenue on warranty claims. Back then, Lennar spent $40 million during the first half of 2003 on claims. In 2004 that increased to $55 million. In this year's first half, the claims total increased to $71.4 million. But because revenue rose at an even faster rate, the claims percentage rate actually fell compared to 2004. It's still above the rate seen in early 2003, however.
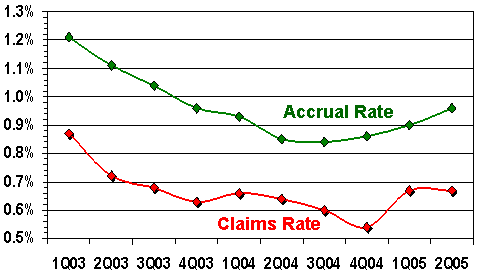
Next we take a quick look at KB Home. What's notable about this chart is how both the claims and accrual rates seem to glide lower then higher, almost in parallel. What's also notable is how both rates are significantly below the industry average.
Figure 5
KB Home
Warranty Claims & Accrual Rates
First Quarter 2003 - Second Quarter 2005
 Source: Warranty Week from SEC data
KB Home appeared four times in the J.D. Power top three: in Albuquerque, Austin, Houston, and Las Vegas. The company noted in a press release that on average, it takes KB Home less than one week to resolve claims. There was no mention of a recent $2 million settlement the company reached with the Federal Trade Commission regarding alleged violations of a 1979 consent decree which prohibited the inclusion of mandatory arbitration clauses in new home warranty policies. As an Investor's Business Daily article noted in July, companies often include the clauses in contracts to avoid costly and time-consuming litigation.
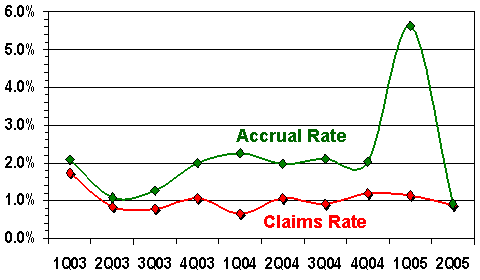
Beazer Homes appeared in the top three in Baltimore and Jacksonville. It did well in numerous other markets too, though it placed below the market average in Washington DC. If we were to plot just Beazer's claims history, we'd say the graph looks inconclusive -- around average and remaining within a narrow range. But then there's that enormous spike in accruals during the first quarter of 2005.
Figure 6
Beazer Homes USA Inc.
Warranty Claims & Accrual Rates
First Quarter 2003 - Second Quarter 2005
 Source: Warranty Week from SEC data
As Beazer explained in its 10-Q filing for the first quarter, numerous homes built in the Midwest by Trinity Homes LLC, a company Beazer acquired in 2002, have either mold or moisture problems. So the company set aside $45 million during the first quarter to fund claims it plans to settle under terms of a class action lawsuit filed in Indiana. After adding and subtracting for routine claims and accruals, this special accrual had the effect of boosting Beazer's overall accrual rate to 5.6%. It's since returned to 0.9%, the lowest it's been in the past ten quarters.
Not Enough Warranty?
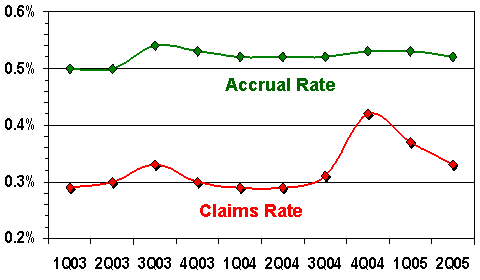
D.R. Horton seems to have a customer relations problem. As the chart below shows, it has an extremely low claims rate. It is by far the revenue leader, with $3.28 billion in new home sales during the second quarter of 2005. In terms of warranty payouts, it's seventh in the industry, with only $21 million in claims recorded so far in 2005. Ordinarily, the chart below would be a good thing, showing claims rates around 0.3% to 0.4% and accrual rates comfortably higher. But then there's the J.D. Power results.
Figure 7
D.R. Horton Inc.
Warranty Claims & Accrual Rates
First Quarter 2003 - Second Quarter 2005
 Source: Warranty Week from SEC data
Pick a city. In Orlando, D.R. Horton is fifth from the bottom. In Atlanta and Las Vegas, D.R. Horton is second from the bottom. In Denver and Washington DC, D.R. Horton is the bottom -- the builder with the lowest customer satisfaction ratings of all.
How can this be? How can a company have both a low warranty claims rate and a low customer satisfaction rating? We don't know, but it reminds us of something a computer maker once said: "If I really thought cutting warranty costs to a minimum was a good thing, I'd just stop answering the phones." In fact, that manufacturer said there was a direct correlation between denied claims, lengthy holding times, and other aggressive warranty cost-cutting behaviors and low customer satisfaction levels.
We hate to compare the claims rates of different companies against one another without knowing what each includes in their warranty tallies, but in this case we can't resist. D.R. Horton had an 0.3% claims rate as of June and paid out $21 million in the first six months of this year. Centex had an 0.4% claims rate and paid out $17.7 million. Both rates are below average, and both payouts are in the lower half of the industry top ten. And of course both are close in terms of numbers. Yet Centex was in the money in 20 out of the 30 markets surveyed, and D.R. Horton was consistently at or near the bottom.
Angry Homeowners
It would appear that some of D.R. Horton's customers took their revenge in the form of filling out J.D. Power and Associates surveys. It would appear that there is such a thing as too little warranty. Suffice it to say that D.R. Horton won't be putting out any press releases about the results of this survey.
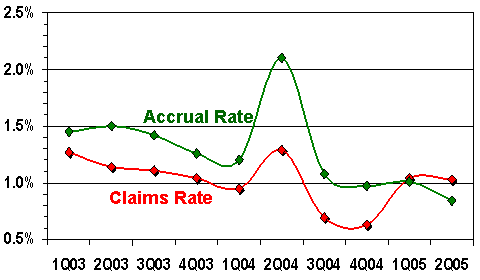
The top ten home warranty providers are rounded out by M.D.C. Holdings, NVR Inc., Fleetwood Enterprises, and Champion Enterprises. M.D.C. and its subsidiary Richmond American Homes are prominent in Denver and Washington, DC, but it ranked near the bottom in both markets. Its warranty track record, meanwhile, is at or slightly above the industry average except for that noticeable spike in the second quarter of last year.
Figure 8
M.D.C. Holdings Inc.
Warranty Claims & Accrual Rates
First Quarter 2003 - Second Quarter 2005
 Source: Warranty Week from SEC data
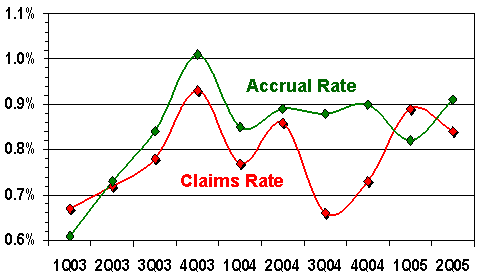
NVR actually did quite well in its primary market of Baltimore and Washington, DC. In Baltimore, its NV Homes brand actually took the top spot, coming in slightly ahead of Pulte, Beazer, and Lennar. In Washington, NV Homes came in sixth out of 22 builders, and was really not very far behind the leaders Centex, Pulte, and Winchester, who coincidentally were in a three-way tie. NVR's Ryan Homes brand, meanwhile, came in a few notches below NV Homes in both cities, but still above the market averages computed by J.D. Power.
Figure 9
NVR Inc.
Warranty Claims & Accrual Rates
First Quarter 2003 - Second Quarter 2005
 Source: Warranty Week from SEC data
As the chart above shows, NVR has a somewhat chaotic but still below average warranty claims and accrual record. Both claims and accruals peaked at the end of 2003, but even then did not exceed the industry averages. On balance, there's really not much news to be found here. NVR is a bit below average in terms of claims, and a bit above average in terms of customer satisfaction. But maybe that is the news: that there's a correlation, within reason, between how much or how little a company spends on warranty and how happy or unhappy their customers turn out to be.
Mobile Homes Are Different
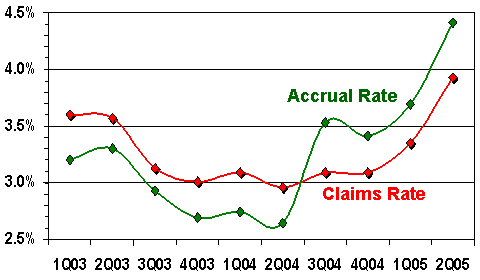
Finally, we're going to include two companies here because we promised you a top ten, even though these are clearly not like the other eight. Fleetwood Enterprises and Champion Enterprises make homes, but they're not site-built homes. Both make the prefabricated homes commonly found in trailer parks, and Fleetwood also makes the drivable kind -- RVs.
Figure 10
Fleetwood Enterprises Inc.
Warranty Claims & Accrual Rates
First Quarter 2003 - Second Quarter 2005
 Source: Warranty Week from SEC data
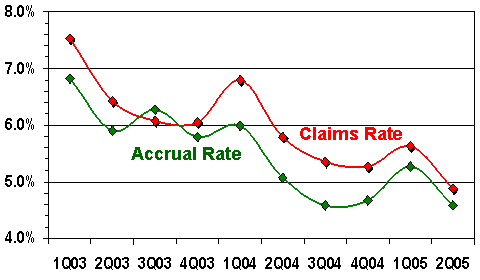
Looking at these charts, it's clear that both Fleetwood and Champion are different in one major respect: they experience much higher than average warranty costs -- dare we say automotive-like warranty spending levels?. In fact, Champion began 2003 with a 7.5% claims rate, which we dare say would have caused the likes of Centex or Pulte to seek the protection of a bankruptcy court. But for a mobile home manufacturer, it's a solvable crisis. And indeed, at last report the company's claims rate had finally settled below the 5% level.
Figure 11
Champion Enterprises Inc.
Warranty Claims & Accrual Rates
First Quarter 2003 - Second Quarter 2005
 Source: Warranty Week from SEC data
J.D. Power and Associates didn't even rank mobile home or RV makers alongside all the site-built home contractors. And they wouldn't belong here either, except they are manufacturing homes, and they are paying warranty claims. Fleetwood, in fact, paid out $47.5 million so far in 2005 -- more than all except Lennar and Pulte. Champion was close behind with $26 million in claims paid during the first half of 2005. So how can we deny the third- and fourth-largest home warranty providers their due, just because some of their homes have wheels?
Love Or Money?
The correlation between customer satisfaction and warranty expense, therefore, is not strong, but it is evident. Sometimes, as with Centex, low warranty twins with high satisfaction. But other times, as with D.R. Horton, low warranty and low satisfaction go together. Pulte has average warranty and high satisfaction. Beazer and M.D.C. have higher claims rates but lower satisfaction rates than either Pulte or Centex.
Because J.D. Power surveyed so many people and because the home builders are so good about segmenting their revenues into warranted and non-warranted sources, the quality of the data used in these comparisons is very high. But there's no simple relationship such as high satisfaction equals low warranty, or high satisfaction equals high warranty. There does seem to be such a thing as too little warranty, however, and that seems to be the difference between D.R. Horton and Centex.
| 


