Warranty Claims & Accruals: In some industries, warranty claims and accrual rates move together in parallel. In others, they each seem to have a mind of their own. This week we take a look at nine months of warranty claims totals and the percentages of sales they represent in nine different industries.
If a picture's worth a thousand words, then this column is a lot shorter than it otherwise would be. What follows are reports on warranty expenditures in nine industries, comparing claims totals for the first, second, and third quarters of 2003 as well as the claims rates and accrual rates seen in each industry.
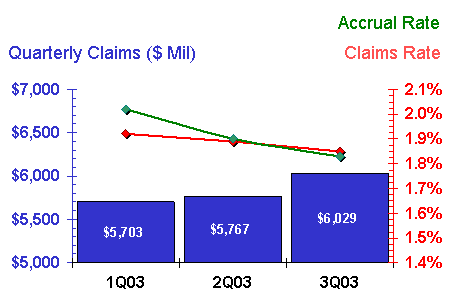
Warranty Week continues to gather the financial reports of U.S.-based manufacturers who include warranty tables in their statements. We're still waiting on 54 annual reports and 26 quarterly reports to be filed as of Dec. 15, but from the data included in 592 others that were already filed with the Securities and Exchange Commission, we can conclude that warranty claims grew in the third quarter to well over $5.85 billion, up from $5.592 billion in the second quarter and $5.527 billion in the first quarter. In the charts below, warranty claims totals are depicted as blue bars -- one for each of the past three completed quarters.
By the time the 80 missing companies file their reports, the figure could rise above $5.9 billion, if third quarter actual claims figures are above the placeholder estimates we're using for them now. Keep that in mind as you browse through the industry estimates provided below. The reports still to come from manufacturers such as Deere & Co. will move the automotive figures up or down, while the reports of Hillenbrand Industries, Hutchinson Technologies, CTI Molecular Imaging, and Varian Inc. will no doubt move the averages in the medical and scientific instrument category. But since each of these companies has been close to industry averages in the past, they probably won't change the numbers much. In a few weeks or a month, though, don't be surprised if you return to the online edition of this article and all the numbers have changed. The first and second quarter reports have changed at least a dozen times each, as new information became available.
Readers whose email systems strip the graphics from messages will not see the charts below displayed correctly. If there are no festive holiday-color-schemed charts below, or if there are empty white boxes where the charts should be, you should take a look at the online edition of Warranty Week to see the missing graphics, and perhaps consider changing to the Plain Text Email Edition by sending a message to the editor.
U.S. Manufacturers' Warranty Claims
Nine Months, 2003
Source: Warranty Week
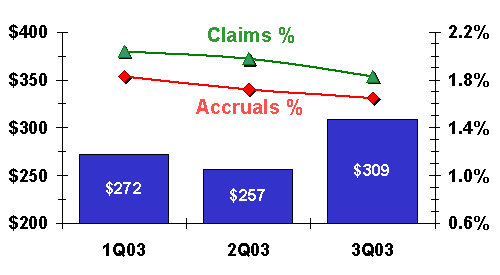
As can be seen from the chart above, warranty accruals (in green) were slightly lower than warranty claims (in red) during the third quarter, reversing the pattern seen in the first and second quarters. This means that manufacturers were depositing slightly less funds in their warranty reserves during the quarter than they were withdrawing to pay claims. But as can be seen in the chart, manufacturers remain in a tight range of 1.8% to 2% in both respects. This means they continue to experience warranty claims and accruals that total less than 2% of product sales. The slope of the line shows whether the rate is increasing or decreasing.
In the charts that follow below, all U.S. companies engaged in manufacturing within a given industry are included. This results in some overlap between the charts, because numerous companies such as General Electric, Brunswick, Honeywell International, United Technologies, Gateway, and Hewlett-Packard are counted in more than one category. If it were possible to slice up these companies' warranty expenditures by industry sector, that would be preferable. The totals for all manufacturers in the top chart, however, count everything only once.
Happy 100th Birthday
Warranty is a function of manufacturing, and this year manufacturers have had plenty of important anniversaries to celebrate. This week is the hundredth anniversary of the Wright brothers' first flight. The Ford Motor Company celebrated its first century in June, and Harley-Davidson turned a hundred years old in August. The first automobile license plate was issued Sept. 1, 1903. This year also is the hundredth anniversary of the invention of the electrocardiograph, and of the completion of the first skyscraper, as well as the 75th anniversary of General Electric's first television broadcasting station, and the first printing of Modern Mechanics magazine. Next year promises the 50th anniversary of the Boeing 707 and the 75th anniversary of the first Motorola car radio, along with the 100th anniversary of the New York City subway.
Does anyone know the origins of the product warranty? All the products named above are commonly sold with warranties today, and indeed all of the manufacturers named are included in the charts below. But when was the first warranty issued? Who filed the first claim? What are the origins of the warranty reserve fund? That's something to think about this Wednesday as the first flight over the sand dunes of Kitty Hawk are re-enacted.
Warranty accounting must be a more recent invention. While some companies such as software publishers prefer to expense product returns directly and immediately, most major manufacturers specifically set aside a fixed portion of sales revenue to pay future warranty claims. It's now seven or eight months since some 600 U.S. manufacturers began including details about their warranty spending in their financial statements. And with three quarterly iterations of data, it's time to do some trend analysis.
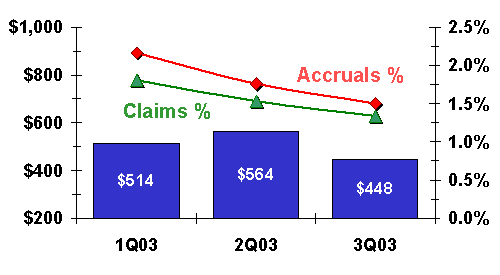
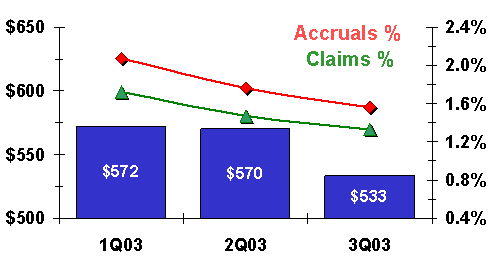
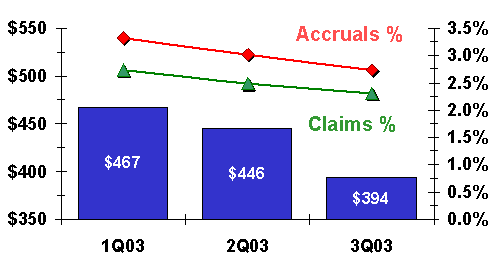
In the aerospace chart below, the slope of the lines shows clearly that both accruals and claims are on a downward slope. In the second quarter, aerospace manufacturers accrued nearly 1.8% of their product revenue to pay future claims, but in the third quarter this was cut to 1.5%. Part of the drop is due to less actual accruals being made, but part also is attributable to rising product revenues.
If the claims rate falls while the accrual rate remains steady, then a boost in revenue is most likely the cause. For while manufacturers traditionally put aside a set percentage of sales each quarter to pay for future claims, they cannot as easily control the amount of claims coming in for products sold in past quarters. But when claims and accruals move in nearly parallel lines, this shows that manufacturers are responding to a change in claims rates with a change in accrual rates. If they're spending less now, they feel they need to put less aside to finance the future.
Aerospace Warranty Claims
Nine Months, 2003
Source: Warranty Week
Things have changed at the top of the aerospace pyramid. United Technologies, makers of jet engines and helicopters as well as air conditioners and elevators, used to have the most claims in this category by far, followed by Boeing. But in the third quarter, they fell to #2 and #3, surpassed by Honeywell International. Keep in mind, however, that major aerospace producers such as General Electric, Lockheed Martin, and Northrop Grumman have not included warranty details in their 2003 financial filings to date. Other major industry players such as Airbus, Bombardier, EADS, and BAE Systems don't have to file with the SEC, because they're not U.S.-based.
There's a similar problem in the automotive industry. General Motors and Ford Motor Co. have roughly 45% of the U.S. market share for passenger cars and light trucks. Most of the manufacturers responsible for the other 55% are not reporting upon their warranty expenditures, because they're ultimately based outside the U.S., even if their factories are in Michigan, Ohio, or elsewhere within the U.S.
GM and Ford have reported more than $5.93 billion in claims during the first nine months of 2003. Does this mean DaimlerChrysler, Toyota, Honda, Volkswagen, and others would have reported $7.25 billion if they were required to do so? Extrapolations such as this are unwise, because while GM and Ford's claims and accrual rates are between 2.5% and 3% of product sales, who knows what the others are experiencing?
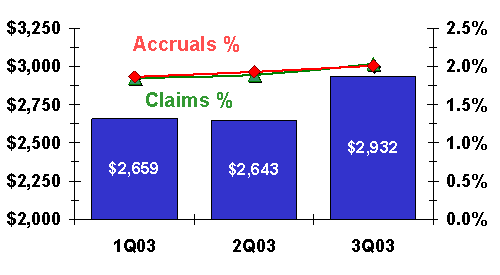
As the chart below shows, the industry-wide claims and accrual rates remain somewhat level in the vicinity of 2%, despite a decline in second quarter claims and a rise in third quarter claims. But what's most striking about this pattern is how the lines for claims and accrual rates are virtually on top of each other. What this means is that as an industry, automotive manufacturers are depositing and withdrawing roughly the same amounts from their warranty reserves. There are no imbalances; no surprises here. Also, it turns out that the long-held rule of thumb of a 2% claims rate and accrual rate in the automotive industry is accurate, at least among the 106 manufacturers included in this category.
Automotive Warranty Claims
Nine Months, 2003
Source: Warranty Week
Notice the big jump in claims, from $2.643 billion in the second quarter to $2.932 billion in the third quarter. As mentioned, this latter figure is partially based upon placeholder estimates for Deere, ArvinMeritor, and a few others who have yet to file their Form 10-K reports with the SEC. So it may change in the weeks ahead. However, of the manufacturers who have already reported, around 55% reported increases in either their claims total or their claims percentage rate, or both. GM alone saw a boost of $170 million in claims from the second to the third quarter, while Ford registered a $40 million increase. But again, because of increased sales, there was only a slight climb in percentage rates.
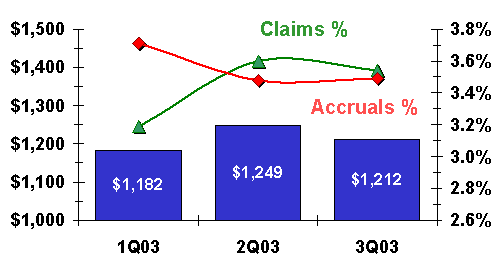
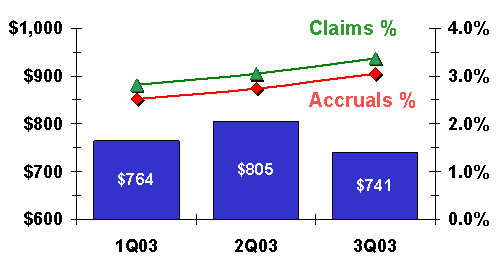
If you want to see the opposite of predictability and balance, look at the chart below. In the computer industry, claims are up; claims are down. Rates go up; rates go down. Not only is there a severe imbalance between claims and accruals, but they also seem to be changing in opposite directions.
Warranty Claims in Computers
Nine Months, 2003
Source: Warranty Week
If the red line were relatively flat, one could blame the arc of the green line on changes in sales revenue. But what this shows is that as a group, computer manufacturers put more aside in the first quarter and less aside in the second quarter, before arriving at a happy medium in the third quarter. As the experience of the aerospace and automotive industries suggests, this is not typical behavior.
While computer manufacturers such as HP, Sun Microsystems, and IBM have been somewhat stable in terms of accrual rates, other well-known names in that industry have changed their accrual rates by as much as 0.9% from one quarter to the next. And we're talking about only three quarters of data here. One can only imagine what their claims and accrual rates were like before warranty tables became a routine part of financial statements.
The chart above does not include most of the disk drive, printer, monitor, or semiconductor equipment manufacturers. Those industry segments are counted separately from the computer sector, although there are some such as HP and IBM that are counted in multiple segments. Readers who wish to see a full analysis of the information technology industry's warranty experience are invited to send a message to the editor to obtain the additional charts.
All data communications equipment makers are counted in the chart below, alongside makers of equipment used for television broadcasting, wireless and wireline telephone networks, and some satellite communications (there's an obvious crossover in that sector with aerospace manufacturers, however).
For telecom equipment makers in general, claims and accrual rates are stable though the claims totals were down significantly in the second quarter and up significantly in the third quarter. This suggests that changes in sales revenue is not as much a factor here, for if it were, the green line would be more erratic and certainly would not be both flat and parallel to the claims line. What this chart suggests, despite what would be expected, is that there is some kind of seasonality to telecom equipment claims. They drop off in the spring and surge in the summer.
Then again, perhaps it has nothing to do with the season of the year. Instead, perhaps one or several telecom equipment makers is having an as-yet unannounced manufacturing quality crisis? We won't name any names, but we do note that among the top 25 telecom equipment makers there are no less than ten who saw either their claims or accrual rate change by more than 1% from one quarter to the next. Four, in fact, changed their accrual rates by 2% or more, which is a dead giveaway that something is amiss on the factory floor. Claims rates are less under their control; accrual rates are what you change when you detect a problem.
Warranty Claims in Telecom Equipment
Nine Months, 2003
Source: Warranty Week
Last week, Lucent and Avaya filed their annual reports, and both saw slight increases in their claims totals for the most recent quarter. However, while Avaya's claims rate was up, Lucent's was down, because that percentage calculation is heavily affected by changes in product revenue. We should note that neither company saw changes in either their claims or accrual rates above 0.14%, so those in search of the suspects should look elsewhere.
Call the Doctor
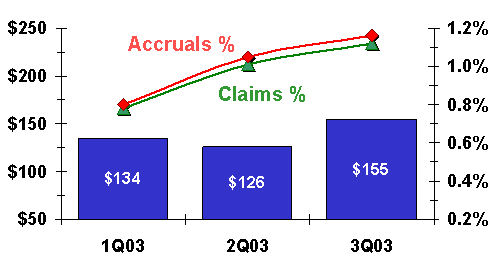
In the chart below, the claims and accrual rates of medical and scientific equipment makers seem to be climbing steadily. But before anyone calls the doctor, please note that even at just under 1.2%, this industry segment is far below the average for all manufacturers. Once again, we wish we had more data from 2001 and 2002 to help explain this recent climb. Which was the aberration? The 0.8% of the first quarter or the 1.2% of the third quarter?
Warranty Claims in Medical Equipment
Nine Months, 2003
Source: Warranty Week
Once again, note the closeness of the red and green lines. While they're not as flat as those seen in the automotive sector, and while they're not declining in tandem as is the case in aerospace and telecommunications equipment, they nevertheless are moving closely together in the same direction. This suggests that manufacturers of medical devices and scientific equipment are responding rather precisely to a rising claims rate.
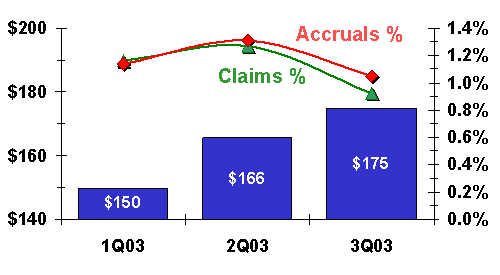
New home builders and manufacturers began the year with both claims and accruals averaging 1.15%. In the spring and summer, claims totals rose steadily while both claims and accrual rates rose and then fell. We can't begin to explain it all, but the seasonality of home sales is of course a suspected factor. The other point we want to make about the chart below is that claims and accrual rates seem to be diverging, albeit only slightly, and in the better of the two possible directions (where withdrawals are less than deposits).
Warranty Claims in New Homes
Nine Months, 2003
Source: Warranty Week
Another industry where seasonality is no doubt a factor is in air conditioning. Air conditioners are sold in the hot months of the year, and one would expect an elevated claims rate in the months of July, August, and September. The only problem is that the chart below suggests precisely the opposite. Claims and accrual rates fell, as did the claims total.
Warranty Claims in HVAC
Nine Months, 2003
Source: Warranty Week
The precipitous fall in claims seen at United Technologies no doubt explains away most of the $37 million decline in claims. The company, parent of Carrier Corp. as well as other units in the aerospace industry and building materials sector, saw claims decline from $125 million in the spring to $49 million in the summer. One could theorize that UTC's diversified product line obscures the true warranty experience of just its air conditioning unit, but the truth is that even at "pure play" HVAC vendors such as York International, Lennox, Tecumseh Products, and Modine Manufacturing Company, claims totals were up or down by only a slight amount in the third quarter, and claims rates barely budged at all.
Warranty activity in the home appliance sector will be among the topics to be discussed this Wednesday (Dec. 17) during Warranty Week's fourth monthly Web-based seminar, featuring Craig Reilly, director of operations for Sears, Roebuck and Company. He reports that Sears is responsible for the sales of some 40% of all home appliances, including not only its own brands but also those of the companies included in the tabulations below.
While there is quite a bit of crossover between HVAC and home appliances, which partly explains away their similarity, what remains unexplained are the noticeable declines. Both Whirlpool and Maytag, for instance, saw both their claims and accrual rates decline from the second to third quarter, even though their claims totals were up slightly from one quarter to the next.
Warranty Claims in Home Appliances
Nine Months, 2003
Source: Warranty Week
Finally, there's the consumer electronics category, and what we suspect is a huge amount of warranty activity. The problem is that most of the manufacturers involved in the industry are based in Europe, Japan, or Korea, and thus are not reporting upon their warranty activities to the SEC. The top vendors included here, in fact, are repeats from other categories that are making forays into consumer audio, video, home office, and home entertainment: Hewlett-Packard, Xerox, Eastman Kodak, Avaya, and Gateway Inc.
Warranty Claims in Consumer Electronics
Nine Months, 2003
Source: Warranty Week
The truth is that warranty in the consumer electronics category cannot be properly analyzed without the inclusion of names like Sony, Thomson, Philips, Hitachi, NEC, Samsung, Toshiba, and Matsushita. While the home appliance chart misses the inclusion of Electrolux and the automotive chart suffers from the absence of the imports, the consumer electronics warranty statistics displayed above are not representative of the industry.
As mentioned, most of the claims included here are reported by companies more at home in other industry categories. The exception seems to be home audio, where domestic speaker makers such as Harman International Industries (makers of the JBL brand), Boston Acoustics, Phoenix Gold (makers of the Carver brand), and Mackie Designs (now called Loud Technologies) still dominate that sector of the market.
|


