| August 18, 2003 | Eric Arnum, Editor |
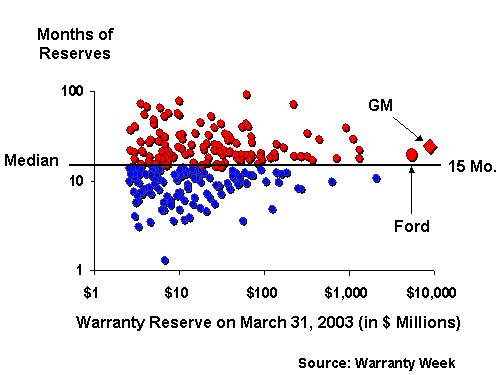
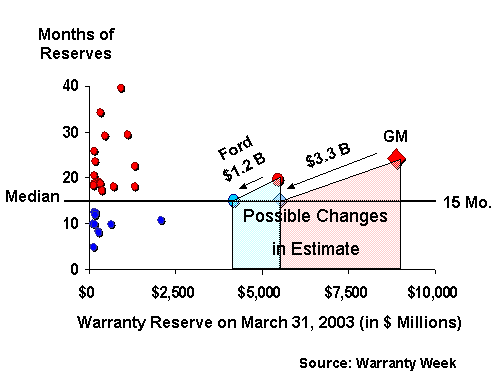
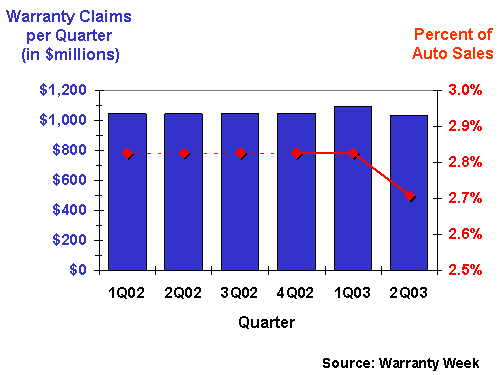
General Motors' warranty change of estimateA plot of the 255 largest warranty reserve funds, along with their reserves-to-claims ratios, is represented in the chart below. The absolute size of the warranty reserve fund is plotted along the horizontal, while the reserves-to-claims ratio is plotted along the vertical. The red dots in the top half represent companies above the median. The blue dots in the bottom half represent companies below the median. Figure 1 Warranty Reserves of the Top 255 Manufacturers GM is represented by the big red diamond to the extreme right. The large red dot nearby represents Ford. The closest blue dot represents Hewlett-Packard Co. The four red dots in a Big Dipper-like cluster represent Dell Inc., General Electric Co., United Technologies Corp., and Boeing Co. Together, Ford and GM accounted for 45% of all reported warranty reserves as of March 31, 2003. They account for 78% of the warranty reserves of just the 90 largest U.S.-based automotive parts and vehicle manufacturers. The size of GM's and Ford's warranty reserves is more noticeable on a chart plotted with a linear scale, as is done below. To make it even more obvious, all but the 30 largest warranty reserve funds have been eliminated. Figure 2 "Right-Sizing" GM's and Ford's Warranty Reserves In the chart below, it's obvious that GM's quarterly outlays for warranty has been remarkably stable over the past six quarters. The high and low quarters are within a few percentage points of the average. Yet the recent decrease in the percentage of sales spent on warranty is equally obvious by the drop in the red line from 2.8% to 2.7%. Figure 3 Six Quarters of GM's Warranty Expense |
| Back to Main Article |

