Honda & Toyota Warranties:
After a couple of bad years, warranty costs at Toyota are getting back to normal. Meanwhile, at Honda, things have never been better, as warranty costs continue to drop.
While sales, production, and warranty costs are returning to normal at Toyota Motor Corp., as the company recovers from disasters both man-made and natural, things have never been better at Honda Motor Co. Ltd., especially in the motorcycle department.
Both companies filed their most recent annual reports with the U.S. Securities and Exchange Commission in just the past week. So while our U.S.-based readers prepare for a round of early summer holidays, let's turn our attention to the top passenger car makers in Japan.
First the good news: After a terrible recent upturn in warranty costs directly linked to safety recalls and virtual hysteria over allegedly out-of-control throttles, Toyota's claims payments are now almost back to where they were in the fiscal year ended March 31, 2008. Accruals are still a bit above fiscal 2008 levels, but they're well below the levels seen in fiscal 2009 through 2011.
We should note that both Honda and Toyota end their fiscal years on March 31. So when we refer to fiscal 2012, we mean the fiscal year that ended three months ago on March 31. Fiscal 2011 is the year that ended 15 months ago.
Claims & Accrual Totals
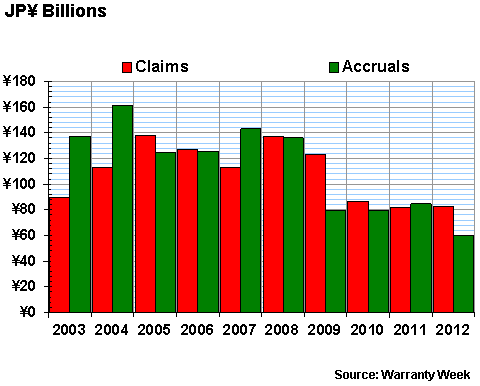
In each annual report, each company discloses the amounts they paid in claims and made in accruals, in billions of yen per year. Those figures are repeated here in Figures 1 and 4 for Toyota and Honda, respectively. The red bars are for claims paid, and the green bars are for accruals made. We won't try to convert these amounts into U.S. dollars, because when we compare these figures to sales the currencies will cancel out anyway.
Figure 1
Toyota Motor Corp.
Warranty Claims Paid & Accruals Made, 2003-2012
(in billions of yen per fiscal year ended March 31)

In the case of Toyota, we've reproduced only the figures for warranty+recalls for the fiscal years 2009 through 2012, because the company discontinued the inclusion of warranty-only figures in this year's annual report (for 2009 through 2011, they included both warranty+recalls and warranty-only figures).
For additional details on Toyota's fiscal 2009-2011 warranty expenses, with and without recalls included, please take a look at the June 30, 2011 newsletter. But the instant analysis of the data in Figure 1 is that whatever warranty crisis Toyota might have had seems to be over.
Claims & Accrual Rates
In Figures 2 and 5, we've taken the data in Figures 1 and 4 and divided them by product sales revenue. This results in two sets of warranty claims rates and warranty accrual rates, expressing warranty costs as a percentage of revenue.
In Figure 2, we can see just how unusual the jump in warranty costs was for Toyota in 2009-2011, and how those rates are now back to where they were somewhere between 2008 (before the recalls became big news) and 2009 (after the upsurge began). They're not quite back to where they were, because sales aren't quite back to where they were either, so the claims rate is still a little above two percent. The company's accrual rate, reflecting a conservative posture, remains a little above 2.5%.
Figure 2
Toyota Motor Corp.
Warranty Claims & Accrual Rates, 2003-2012
(as a % of product sales)
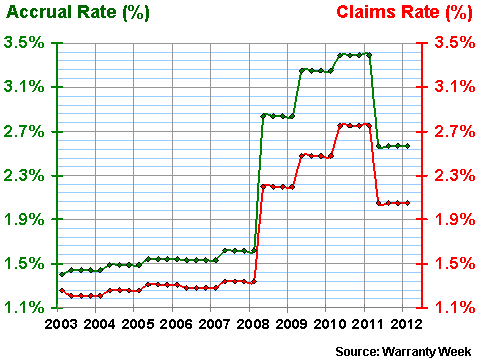
Figure 1 gives just the balances. Figure 2 gives the percentage rates. In Figure 3, we're completing the picture with two more metrics: The fiscal year-ending balance in the warranty reserve fund (once again in billions of yen) and the amount of claims-paying capacity that balance represents.
Claims vs. Reserves
In Figures 2 and 5, as well as in Figures 3 and 6, we're assuming that the metrics calculated for the end of the year or for the year as a whole are also valid for the quarters within the year. This of course is rarely the case, but it's also true that any extrapolations would be equally inexact.
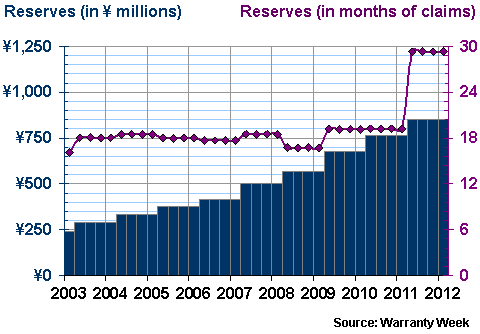
But forget the reserve balance for a second. Toyota has always kept enough funds in its warranty reserve to pay about 18 months of claims, whatever the monthly claims payments were at the time. When the monthly claims payments rose, so did the reserve, keeping the ratio between claims and reserves at about 18 months.
But in Figure 3, we can see that the ratio suddenly shot up to almost 30 months in the most recent fiscal year. That's higher than it's ever been. And this is why we said the company was maintaining a conservative posture with its accrual rate. At the current rate of 2.5% of sales, the company is accruing far more than it needs to maintain a ratio of 18 or 19 months between claims and reserves.
Figure 3
Toyota Motor Corp.
Warranty Reserve Balance & Capacity to Pay Claims,
(in billions of yen & months, 2003-2012)
So perhaps Toyota should have cut accruals back to where they were in fiscal 2008? At 348 billion yen, claims in fiscal 2012 were about 7.4% above 2008 levels. But at 437 billion yen, Toyota's 2012 accruals were more than 11% above 2008 levels. And that's nearly 45 billion yen -- or nearly US$542 million at current exchange rates. That's a lot of excess funds.
However, that's not how people behave after a crisis. When it's over, they always worry about it happening again. That goes for product failures and massive recalls, in the warranty domain. And it goes for natural disasters and terrorist attacks as well. For how long after 9/11/01 were people still saying that it was just the first attack? How many times have people predicted "another Lehman" since 2008?
The truth is, catastrophic events rarely come in pairs. But human nature tends to expect them to do so. And the process of accruing for warranty expenses, no matter how much math and how much analysis is done, is also partially shaped by emotion.
Honda's Warranty Expenses
Compare and contrast the Toyota record to its close competitor, Honda Motor Company. The two used to be thought of as a pair. And from 2003 to 2008, they were both always at the low end of the spectrum when it came to warranty expenses, and towards the high end of the scale when it came to perceived quality and reliability.
In Figure 4, it's pretty clear that Honda's warranty claims and accrual totals are falling. In the year ended March 31, Honda accrued only 60 billion yen, after paying claims of only 82.5 billion yen. And although that claims total was slightly higher than fiscal 2011's, both those years are lower than anything else on the chart.
Figure 4
Honda Motor Co. Ltd.
Warranty Claims Paid & Accruals Made, 2003-2012
(in billions of yen per fiscal year ended March 31)
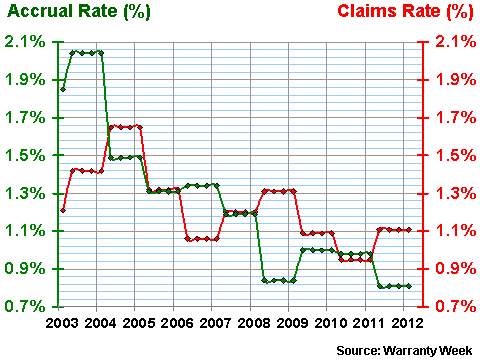
And it's not because of the recession. As can be seen in Figure 5, the downward trend is also in evidence after accounting for sales totals. Honda's lowest accrual rate ever was measured in the most recent fiscal year, which was slightly below even 2009's astonishingly low 0.84% rate. Its lowest-ever claims rate was in fiscal 2011, though the most recent year's level was a still-respectable 1.1%.
Figure 5
Honda Motor Co. Ltd.
Warranty Claims & Accrual Rates, 2003-2012
(as a % of product sales)
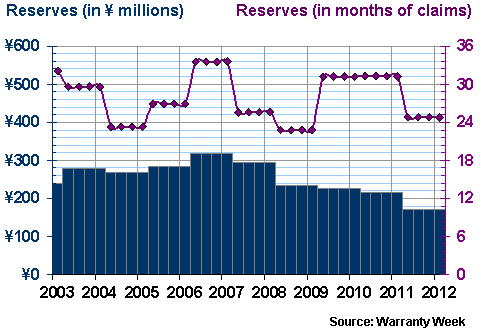
In addition, the downward trend is confirmed in Figure 6 by Honda's declining warranty reserve fund balance. Its height came in fiscal 2007 at 317 billion yen. And the lowest it's been so far was the 170 billion yen level it hit in March 2012.
Honda hasn't been as consistent when it comes to managing the ratio between claims and reserves, however. In Figure 6, Honda's average claims-to-reserves ratio is 28 months. But it bounces around from 23 to 34 months.
Figure 6
Honda Motor Co. Ltd.
Warranty Reserve Balance & Capacity to Pay Claims,
(in billions of yen & months, 2003-2012)
The reason probably has something to do with product mix. Unlike Toyota, which makes cars and not much else, Honda also makes motorcycles and generators. And cars are of decreasing importance. At 5,806 billion yen, Honda's worldwide car revenue was lower in 2012 than in any other year since 2003. And at 78%, it accounted for a lower share of total product revenue than ever before.
So perhaps Honda's shift from passenger cars to motorcycles is impacting its warranty metrics? We wouldn't know, because all we can see from the outside is one set of figures for cars, motorcycle and generator warranty combined. We can't even check whether warranty costs are proportional to sales in Japan, Asia, North America, and Europe.
Warranty Accruals Per Unit
Still, since both companies do release figures for both units sold per product type and revenue generated per product type, we can calculate average prices for each product and make some reasonable guesses about warranty costs.
On that basis, we're estimating that Toyota accrued about US$723 per vehicle in fiscal 2012 -- slightly more than it did in fiscal 2009 and more than twice as much as in fiscal 2007. Honda, meanwhile, accrued only about US$182 per car in fiscal 2012 -- less than ever before. So while things are getting back to normal at Toyota, things at Honda have never been better.
Institute of Warranty Chain Management
Warranty Management Professional Development Survey
The Institute of Warranty Chain Management (IWCM) is conducting research into the warranty industry. We are inviting established warranty management professionals to aid us in creating the best possible resource for the warranty and service contract industries. We would greatly value your insights on your needs as a warranty professional and your impression of the overall needs of the warranty community as it relates to professional development and career paths.
If you would like to make an impact on the industry's future, please complete this short survey. Your responses are voluntary and anonymous. All responses will be aggregated and blinded for analysis. The survey will take less than two minutes to complete. Responses are appreciated by Friday, July 13th.
Thank you for your time and support to help build the warranty profession. If you have any questions, please contact IWCM Chairman Terry Hawkins at gterry.hawkins@gmail.com.
Please use the link below to take our short survey:
http://goo.gl/CF2w4
3rd Annual Conference:
Extended Warranty & Service Contract Innovations
August 1-2, 2012 in Chicago
Master the strategies for designing, marketing and operating a profitable and efficient extended warranty or service contract business. Join us at the Extended Warranty & Service Contract Innovations conference, August 1-2, 2012, at the Avenue Crowne Plaza in Chicago. Hear insights and action steps from 20+ top industry leaders representing all sides of the industry. This is your best opportunity to meet who's who in the extended warranty and service contract business. Registrations are rolling in quickly, so register now to ensure your spot.
Hear case study innovative strategies from Ford Motor Company, Lowe's Companies, PerkinElmer Health Sciences, Sears Holding Company, Eaton Corporation, and Grant's Appliance, Electronics and More.
Agenda highlights include panel debates and individual case studies on:
- Pricing: How much is too much?
- Combating Negative Connotations of Extended Warranties
- Reaching out to new customers
- Combating Fraud
- Streamlining and Integrating Your Business Operations
- Implementing New Performance Measurement Practices
- Risk Financing and Risk Management
- Legal insights session on what you can and cannot do.
Plus, don't miss Mark Bardusch, National Sales & Marketing – Extended Service Business, Ford Motor Company, as he talks about the automotive industry, which you can benchmark against your own company for inspired ideas. To see the complete agenda, visit www.warrantyinnovations.com.
Use the Warranty Week Subscriber Discount Code "WRN15" to receive $300 off the current rate of the conference.
The fee for attending this conference is as follows:Standard rate through June 29, 2012: $1,195
Standard rate after June 29, 2012: $1,395
Reserve your place and register now. Please call +1.561.674.0086 for conference details or for special group pricing.


