Warranty Reserve Capacity:
The ratio between warranty reserves and claims payments is always changing. But by measuring departures from the baseline average, we can detect which companies have either too much or too little money in their warranty accounts.
For the past few weeks, we've been on the lookout for the largest increases or decreases in various facets of warranty accounts. Sometimes they're signs that a company's warranty process is vastly improving or deteriorating. Other times, they're the result of acquisitions or divestitures.
This week, we're finding that many of the anomalies in amounts or ratios are simply the result of unfortunate timing. The bills come late or the bills come early, disrupting the relationship between claims and reserves.
But the goal remains the same: Since we can't compare one company to another directly, we will instead compare a company against itself over time. Once we know the baseline, we can measure the changes. Then we can compare the changes. And by doing so, we can make a list of the biggest changes.
Warranty Metrics
In the October 13 newsletter, we looked at some of the biggest changes in claims rates. In the October 20 newsletter, we looked at how some of the biggest acquisitions and divestitures impacted warranty accounts. In the October 27 and November 3 newsletters, we documented some of the biggest downward and upward changes of estimate. And then in last week's newsletter, we looked at foreign exchange conversions.
This week, we're going one step deeper, taking the amount in the warranty reserve and the amount of claims payments and creating a ratio. And then we're looking for not only the largest and smallest ratios, but also the biggest sudden changes.
In Figure 1 below, we've charted the combined warranty reserve fund balances of all U.S. based manufacturers, as measured at the end of each of the last 34 quarters, since the start of 2003. We've also charted a measure of the capacity of those reserves to pay claims, calculated by dividing the ending balance by the monthly claims payments.
For instance, in June 2011, at the end of the second quarter of this year, all U.S.-based manufacturers reported a combined $34.3 billion in warranty reserves. During the quarter, they paid claims at a rate of $1.98 billion per month. Therefore, as of June, their reserves had a capacity of 17.3 months.
Long-Term Averages
Over the course of the past 8-1/2 years, that capacity has ranged from a low of 15.5 months in late 2009 to a high of 17.8 months in the first quarter of this year. The long-term average since 2003 has been very close to 16.9 months.
In other words, U.S.-based manufacturers have, on average, kept the size of their warranty reserve funds just below what they'd pay out in claims in one-and-a-half years. And that, in turn, implies that the average length of a product warranty is about one-and-a-half years.
Figure 1
All U.S.-based Warranty Providers:
Average Warranty Reserve Fund Capacity
2003 to 2011
(Amounts in US $ Billions & Months)
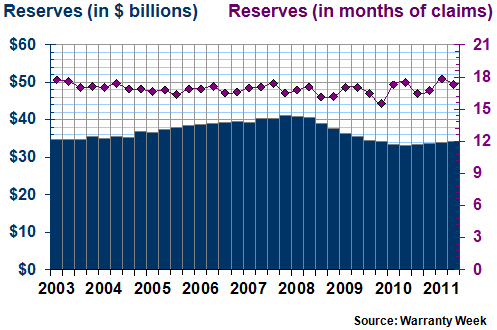
The warranty reserve fund balance, meanwhile, hit a high of $41.2 billion in late 2007 and a low of $33.2 billion in the middle of 2010. It's increased for the last four quarters in a row, but it's still below 2003 levels.
We don't mean to imply that high reserve fund balances are somehow good. Indeed, if increased product reliability is causing claims payments to fall, then lower balances might be more fitting.
Deviations from the Average
But we're not really looking at increases or decreases in the balance. What we're looking for this week are the biggest deviations from the average ratio between reserves and claims. We're calling that ratio the reserve capacity. It's calculated as follows:
While the long-term average for all products is 16.9 months, it should be larger for products with long warranties and smaller for products with short warranties. In other words, companies that sell products with extra-long warranties should also have extra-large warranty reserve capacities. And companies with 30- or 90-day warranties would probably have reserve capacities of a few months at most.
Once we know the long-term baseline averages, we can look for short-term deviations from the trend. And the deviations should be in the opposite direction. If, for example, a company has a sudden massive rise in claims, it should also see its warranty reserve capacity fall far below the long-term average. If claims payments suddenly fall, the capacity should soar.
We started out with a list of 602 companies that paid claims and maintained a warranty reserve fund. But we found the smaller companies to be too unstable when it came to these particular warranty metrics. And so, in Figure 2, we're looking for the highest reserve capacities among just the 241 companies that paid out more than $5 million in claims last year.
The average was computed by taking the ten most recent warranty capacity readings, for the years 2009, 2010, and the first half of 2011. In cases where a company's warranty capacity suddenly spiked over 120 months, that single measurement was omitted from the averaging.
In other words, these are calculations that overlook the temporary anomalies, looking for a true long-term baseline average. Most are the average of ten quarterly measurements, but some that included one extreme measurement are an average of just the nine remaining "normal" data points.
Largest Warranty Reserve Ratios
At the top of the list is a name that steady readers of the past few newsletters will recognize. Foster Wheeler AG, a global engineering and construction company focused on building energy and petrochemical infrastructure projects, maintains a warranty reserve equal to what it pays in claims in 208 months. In relative terms, that is by far the largest warranty reserve we found, which we suspect is what comes with the territory when you're building power plants and oil refineries.
Second on the list is SunPower Corp., a solar panel manufacturer that provides a 25-year warranty. The company, in fact, just turned 25 years old last year, so some of its first few installations are probably now out of warranty. But for the future, the company is maintaining a relatively large reserve equal in capacity to what it pays out in 130 months at current rates.
Figure 2
Top U.S.-based Warranty Providers:
Largest Warranty Reserve Capacities
2009 to 2011
(Amounts in US $ Millions & Months)
| Company | Claims | Reserves | Average |
| Name | Paid 2010 | Jun 2011 | Capacity |
| Foster Wheeler AG | $13 | $101 | 208 |
| SunPower Corp. | $5.3 | $79 | 130 |
| Valspar Corp. | $9.2 | $76 | 111 |
| Associated Materials LLC | $7.1 | $96 | 90 |
| M.D.C. Holdings Inc. | $8.8 | $31 | 75 |
| Energy Conversion Devices | $6.5 | $38 | 59 |
| General Dynamics Corp. | $51 | $255 | 55 |
| Boeing Co. | $234 | $1,030 | 53 |
| Toll Brothers Inc. | $13 | $46 | 51 |
| KB Home | $45 | $83 | 49 |
Source: Warranty Week
Valspar is an automotive company known for its paints and coatings. Associated Materials LLC makes windows and aluminum siding for buildings. General Dynamics and Boeing make civilian jet planes. M.D.C., Toll Brothers and KB Home are residential homebuilders. What they all have in common is the sale of a product that carries longer-than-average warranties, and which therefore needs a thicker-than-usual cushion in the warranty reserve fund.
For the most part, those companies with the largest warranty reserves as measured in dollars were towards the middle of the pack when it came to calculating reserves-to-claims ratios.
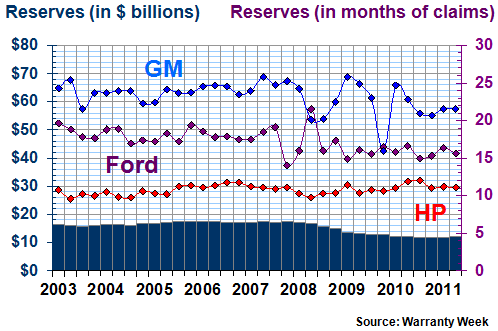
General Motors averaged 22 months. Ford Motor was at 16 months. Hewlett-Packard came in at 11 months. United Technologies was 34 months. And General Electric was 25 months. The averages for GM, Ford and HP are detailed below.
Figure 2a
U.S.-based Warranty Providers:
3 Largest Warranty Reserve Capacities
2003 to 2011
(Amounts in US $ Billions & Months)
Means and Medians
Of the 602 companies we initially tracked, 293 had a warranty capacity above the 16.9-month weighted average, while 309 were below it. The median is 16.5 months. And about half the averages were between 10 and 29 months.
That's not to say that any given number is the "right" average. The appropriate size of a warranty reserve depends on the products sold, the length of the warranties that cover them, the predicted failure rate, and the average cost of repair. And of course, these metrics need to be monitored and revised as conditions change.
But in fact, with a well-run warranty process, the capacity of a company's warranty reserve fund should always be close to the average length of its product warranties. So if we're looking at what we believe is a well-run company, its warranty reserve-to-claims ratio is probably close to the average length of its product warranties.
When a product is sold, the manufacturer is supposed to accrue enough funds to cover all predicted warranty claims over the life of the product's warranty. If those predictions are correct, the amount of claims paid through the end of production would equal the amount of accruals made at the time of production. And the warranty reserve fund balance would always contain enough funds to pay all remaining claims, until every warranty is expired.
Therefore, the more revealing metric would be to measure the difference between a company's warranty reserve capacity and the average length of its warranties. Those who provide 10-year warranties but have only five years of funds on hand are under-accruing. They'd better change their formula before funds run out. And those with one-year warranties that are keeping five years of reserves are over-accruing. They'd be wise to reduce their reserves and free up some profits.
Calculating Warranty Durations
The problem is, external observers would have a difficult time trying to calculate the average length of a company's warranties. First, one would need to know the age and size of its installed base. Second, one would need to calculate the number of months of warranty remaining for each product. And third, one would have to keep that model moving, as new sales add to and expirations take away from the totals.
Even with a fairly homogenous product line such as computers or passenger cars, there are differences to consider. Business computers usually get three-year warranties. Consumer models get a year. Cars sold in the U.S. usually get three or four years of warranty. Cars sold in Asia might get only one or two. Powertrains get a few years extra. And most of the warranties can expire on mileage alone.
So we're not going to comment on the typical length of a given company's warranty, or the appropriate size of its warranty reserve. But in Figure 2 it's somewhat easy to find reasons why a given company would tend to end up at the top end of the scale, because of their product line.
Smallest Reserve Capacities
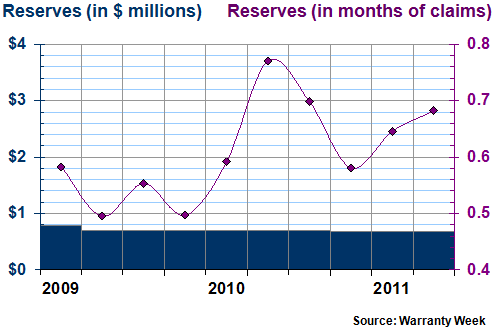
In Figure 3, we can make some of the same assumptions about why a given company is comfortable with a relatively small warranty reserve. The Pep Boys - Manny, Moe & Jack, for instance, are paying out a little over $1 million in claims per month, as a favor to their retail customers who are buying automotive parts and products either not covered or only lightly covered by a manufacturer's warranty. But its warranty reserves stood at only $673,000 as of April 30, 2011. This means the company has only about 18 or 19 days' worth of funds in its reserve.
Fear not, if additional funds are needed, the company can always take some money out of the cash register. It is a retail operation, after all. And only a small portion of its product line is covered by a Pep Boys warranty. Most of the products have their own manufacturers' warranties. And we should also note that the amount of Pep Boys' claims has always been close to the amount of its accruals, so the average capacity has been close to this level for years, without incident.
Figure 2b
Pep Boys Warranty Reserve Capacity
2009 to 2011
(Amounts in US $ Millions & Months)
LKQ isn't so easy to defend, however. The company manufacturers motorcycle parts for the aftermarket. And until recently, its warranty reserve was smaller than what it paid out for two months of claims. It's larger now, hitting 3.2 months in the quarter ending in June 2011. But as can be seen in Figure 3, it had the second-smallest average warranty capacity among all companies paying out more than $5 million in claims last year.
Figure 3
Top U.S.-based Warranty Providers:
Smallest Warranty Reserve Capacities
2009 to 2011
(Amounts in US $ Millions & Months)
| Company | Claims | Reserves | Average |
| Name | Paid 2010 | Jun 2011 | Capacity |
| Pep Boys | $13 | $0.67 | 0.6 |
| LKQ Corp. | $7.0 | $5.6 | 1.7 |
| DDi Corp. | $6.6 | $1.2 | 2.2 |
| American Woodmark | $6.6 | $1.7 | 2.6 |
| Standard Motor Products | $51 | $15 | 3.0 |
| W.W. Grainger Inc. | $11 | $3.1 | 3.6 |
| Extreme Networks Inc. | $6.6 | $2.6 | 5.9 |
| Polycom Inc. | $20 | $11 | 6.0 |
| Sirona Dental Systems | $17 | $9.5 | 6.4 |
| Electro Scientific Industries | $5.5 | $4.7 | 6.5 |
Source: Warranty Week
It's entirely possible to run a company with six months or less warranty reserves on hand. In fact, it's possible to run a company without warranty reserves at all, paying claims out of cash on hand. And it's possible to run a company without warranties too. Unlike in many countries, there are no U.S. laws requiring warranties at all(except in certain anti-pollution and safety-related instances).
But while it's possible to sell manufactured goods without warranties, or to manage payments out of cash on hand, it might not be the most prudent thing to do. If, for instance, one is keeping very small amounts of reserves on hand, and if claims suddenly jump for one reason or another, the expense could exceed reserves, and could radically reduce net income. And that defeats the whole reason for using the accrual method: to prepare for expenses at the time they are expected to arrive, so that income levels remains steady and predictable.
But one can never really prepare for the unexpected. In recent weeks, we've detailed multiple instances where claims spiked to surprisingly high levels, requiring companies to add funds to their warranty reserves. Some of those same companies are listed below in Figure 4, because what we've really been doing for the past few weeks is measuring the same events in a different way, using different metrics.
Above & Below the Average
In Figures 4 and 5, we're looking at the largest short-term divergences from the long-term average. If, for instance, a company has always kept its warranty reserve balance close to 12 times as much as it pays per month in claims, but the claims rate suddenly falls, that's going to impact the claims-to-reserve ratio. Or if some large claims payments are time-shifted from one quarter to the next, the average reserve capacity could spike and then fall.
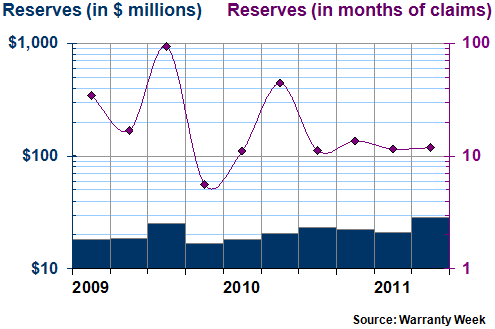
Take the example of oil and gas equipment maker FMC Technologies. In the second quarter of 2009, it was paying roughly $1.1 million a month in claims, with a reserve that had a capacity of 17 months. But then in the third quarter claims payments slowed and the monthly total fell to $267,000 a month. Then when accruals didn't slow down, that helped drive the reserve balance all the way up to $25 million, or 94 months.
And then in the fourth quarter some of those time-shifted claims had to be paid. The company paid out $3 million per month during that quarter, and accrued only $2 million per month. So the warranty reserve, which had reached a capacity of 94 months by September, was down to only 5.6 months by December. In that third quarter, it was more than three times higher than its 25-month average. And in the quarter that followed, it was 78% lower than average.
Time-Shifted Claims Payments
In other words, it was most likely a case of delayed payments, not product repair disasters, that placed FMC at the top of the list of increases. The graph below uses a logarithmic scale to better display the change in FMC's reserve capacity.
Figure 3a
FMC Technologies Warranty Reserve Capacity
2009 to 2011
(Amounts in US $ Millions & Months)
What we're seeing for Cypress Semiconductor is most likely the reverse: claims payments were time-shifted from the third to the second quarter of 2009, driving capacity down to only three months, some 77% below the long-term average. And then in the very next quarter, the reserve capacity snapped back to average levels.
Figure 4
Top U.S.-based Warranty Providers:
Biggest Warranty Reserve Capacity Changes
Downward Divergence from the Average
2009 to 2011
(Amounts in Months & Percent)
| Company | Average | Quarterly | Downward |
| Name | Capacity | Period | Divergence |
| FMC Technologies Inc. | 25 | 4Q09 | -78% |
| Cypress Semiconductor | 13 | 2Q09 | -77% |
| RBS Global Inc. | 23 | 1Q09 | -76% |
| Hubbell Inc. | 13 | 4Q09 | -73% |
| Foster Wheeler AG | 208 | 2Q10 | -72% |
| Harman International | 35 | 3Q09 | -72% |
| Acuity Brands Inc. | 13 | 2Q10 | -72% |
| Visteon Corp. | 45 | 4Q09 | -71% |
| Steelcase Inc. | 21 | 1Q09 | -70% |
| UTStarcom Holdings | 21 | 3Q09 | -68% |
Source: Warranty Week
Among the 241 companies measured ten times each, there were only 15 instances where a company's warranty reserve capacity fell by two-thirds or more. Figure 4 lists the top ten. The other five instances were Nvidia Corp. (in the second quarter of 2010); Ryland Group Inc. (in the third quarter of 2010); Daktronics Inc. (in the fourth quarter of 2009); Actuant Corp. (in the third quarter of 2009); and Steris Corp. (in the first quarter of 2011).
Technically, there is a limit to how far the reserve capacity can fall below its long-term average. If its capacity somehow fell to 0, it would be 100% below average. But in practice, we found only these 13 instances where the short-term capacity fell by 67% to 78% below the long-term average.
Falling Claims, Rising Capacity
At the other extreme, there is no limit at all. If claims payments fell to some tiny amount, perhaps because of time-shifting, a warranty reserve could temporarily hold more than a century's worth of funds. For instance, the company on top of the list in Figure 5 once saw its reserves-to-claims ratio grow to more than 154 years.
Steris Corp., a medical sterilization equipment manufacturer based in Mentor, Ohio, has encountered significant problems with the U.S. Food and Drug Administration. Its problems began in 2008 when the FDA informed the company that its sterilization equipment had been modified so significantly that it would have to undergo a new round of clearance testing. The company objected, and the dispute escalated until Steris finally agreed to take the product off the market in 2012.
This played havoc with product shipment and repair rates. Remember, most of the customers were themselves heavily regulated and insured, so one can imagine what they did when the FDA told them their sterilization equipment was out of compliance. No matter how good it was, it wasn't used. So it didn't break.
In warranty terms, claims fell to a trickle during the months of July, August and September 2010. Steris paid only $10,000 in claims that quarter, on $197 million in sales. Its warranty reserve fund balance grew slightly to $6.2 million by September 30. But the ratio between reserves and claims spiked to 1,856 months! In the chart below, we used a logarithmic scale to graph this sudden spike.
Figure 4a
Steris Warranty Reserve Capacity
2009 to 2011
(Amounts in US $ Millions & Months)
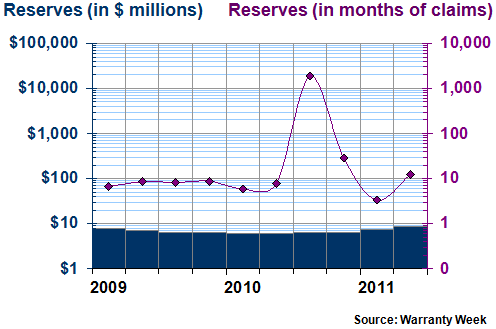
The log scale obsures the fact that even in the fourth quarter of 2010, Steris was still far above average with a reserve capacity ratio of 29 months. Then, as claims came in during early 2011, the ratio fell back to 3.3 months by March. Now, it's once again near its long-term average, a little above 12 months as of June 2011.
Not Always Product-Related
We can't tie each and every member of the top ten list below to such a product-driven fiasco. However, each of these increases has been either preceded or followed by a decline in the ratio between reserves and claims. For instance, we already mentioned that Steris was one of only 15 companies that saw their reserve capacity fall by two-thirds or more below average. And while it didn't make the top ten of Figure 4, that precipitous fall came six months after the precipitous rise documented below.
Figure 5
Top U.S.-based Warranty Providers:
Biggest Warranty Reserve Capacity Changes
Upward Divergence from the Average
2009 to 2011
(Amounts in Months & Percent)
| Company | Average | Quarterly | Upward |
| Name | Capacity | Period | Divergence |
| Steris Corp. | 10 | 3Q10 | +18,325% |
| Illumina Inc. | 7.6 | 2Q09 | +3,117% |
| First Solar Inc. | 22 | 3Q09 | +2,395% |
| Paccar Inc. | 22 | 4Q10 | +1,742% |
| Fuel Systems Solutions | 22 | 4Q10 | +1,628% |
| Accuray Inc. | 8.5 | 2Q11 | +1,086% |
| Daktronics Inc. | 15 | 4Q09 | +998% |
| Harris Corp. | 23 | 2Q09 | +960% |
| Teleflex Inc. | 29 | 2Q11 | +815% |
| Meritage Homes Corp. | 38 | 2Q09 | +444% |
Source: Warranty Week
We found a total of 21 companies that saw their reserves-to-claims ratio soar to at least three times its long-term average. The top ten are listed in Figure 5. The other 11 are Analogic Corp.; Associated Materials LLC; Cypress Semiconductor Corp.; Energy Conversion Devices Inc.; FLIR Systems Inc.; FMC Technologies Inc.; JDS Uniphase Corp.; Lear Corp.; Life Technologies Corp.; Modine Manufacturing Co.; and Tenneco Inc.
Familiar Names
Two of those 11 also made the list in Figure 2. In other words, both Energy Conversion Devices and Associated Materials, which already had two of the highest reserves-to-claims ratios as a long-term average, also saw those high rates more than triple temporarily.
Energy Conversion Devices went from an average of 59 months to a high of 312 months in 2009. Then it fell back to average levels in 2010. But then its ratio jumped to 214 months earlier this year. It would seem that no matter how we measure anomalies from week to week, this company is always on the list.
Associated Materials, meanwhile, saw its claims rate fall precipitously this year, a welcome event that coincidentally occurred right after a major acquisition that we covered in the October 20 newsletter. And so, its return appearance this week is to be expected, because falling claims and growing reserves both cause the reserves-to-claims ratio to soar.
Then again, that ratio remained relatively high in the quarter ended July 2, 2011. So perhaps it's time for the company to examine whether it really needs $96.5 million in warranty reserves, given a current payout rate of only $404,000 a month?
Then there are two companies that made the list in Figure 4 and almost made the list in Figure 5: FMC and Cypress. In both cases, the not-quite-top-ten spikes immediately preceded the top-ten declines, suggesting that they were nothing more than unfortunate cases of time-shifted claims payments and/or reimbursements.
When we know what's "normal" and what's typical and average for a given company, then we can measure deviations from that baseline. When we take a look at the claims, accruals, and reserve totals for a warranty provider, and when we go deeper and look at their acquisitions, divestitures, foreign currency conversions and other warranty-related adjustments, what we're looking for are changes that are so massive that they are among the biggest increases or decreases among hundreds of manufacturers.


