Five-Year Warranty Trends, Part Six:
The total balance in all U.S. manufacturers' warranty reserve funds first surpassed $40 billion in 2007. The total is up 4.3% since 2006 and is up 16% since 2003. But while balances in some industry sectors are soaring, in others they're actually shrinking from year to year.
At the end of 2007, some 900 U.S.-based manufacturers had collectively reported having some $41.1 billion in their warranty reserve funds, up by more than $1.7 billion since the end of 2006. It's been growing steadily over the past five years, ending 2003 at $35.5 billion and surpassing $38 billion by the end of 2004.
Warranty Week has been collecting the warranty reports of all U.S. manufacturers from their financial statements since the start of 2003. Since that time, manufacturers have been required to report the beginning and ending balances in their warranty reserve funds, as well as any net additions (accruals) or subtractions (claims).
In the past five newsletters, we've examined the additions and subtractions in detail. In the April 29 issue, we began to examine the warranty reserve balances, expressing them not only in dollars, but also as a measure of capacity to pay claims. In this column, we will delve deeper into those balances.
Of course, we can't compare one company to another, because the size of a given warranty reserve has everything to do with how many products were sold and how long the warranty will last on each unit. Unless two companies make an identical product and sell exactly the same number of them, there is no reason for them to have the same warranty reserve balance. However, we can measure changes in that balance over time, and then compare the changes to each other.
Comparing Balances Over Five Years
We took all manufacturers reporting a balance of more than $10 million in their warranty reserve as of Dec. 31, 2007 (some 217 companies), and calculated the percentage increase or decrease since the end of 2006 (Figures 1 & 2), and since the end of 2003 (Figures 3 & 4). Some of these changes were massive, caused primarily by acquisitions or divestitures. But in a few cases, the changes had more to do with the products themselves.
In Figure 1, for instance, the poster boy for manufacturing glitches is once again at the top of the list. Because of the huge number of Xbox 360 units that proved to be defective, Microsoft was forced to increase the size of its warranty reserve from $10 million in June 2006 to $861 million by the end of 2007. Microsoft didn't even bother to report its year-end 2006 balance -- so casual was the company about its warranty obligations back then -- but we're estimating it to have been around $11.5 million. If that's the case, the reserve has grown by some 7387% in a single year. And Microsoft now has the ninth largest warranty reserve fund in the country, behind only GM, Ford, HP, GE, United Technologies, Caterpillar, Boeing, and Dell.
Figure 1
Top U.S.-based Warranty Providers:
Largest Warranty Reserve Increases,
2007 vs. 2006
(in $ millions and percent gain)
| Warranty | Vs. | |
| Reserve | Year | |
| Company | 12/31/07 | Before |
| Microsoft Corp. | $861 | +7387% |
| CalAmp Corp. | $13.8 | +2353% |
| CommScope Inc. | $29.2 | +1296% |
| Bucyrus International | $70.9 | +1125% |
| MPC Corp. | $41.2 | +887% |
| SunPower Corp. | $17.2 | +399% |
| Cypress Semiconductor | $20.3 | +236% |
| Nautilus Inc. | $25.2 | +157% |
| Ion Geophysical Corp. | $13.4 | +115% |
| Garmin Ltd. | $71.6 | +90% |
While some of these percentage increases may look a bit scary, keep in mind that sales increased as well. For instance, at Garmin annual sales grew from $1.7 billion to $3.1 billion -- nearly an 80% increase. So it's not surprising that the warranty reserve grew from $37.6 million to $71.6 million during the same time period. Claims also rose, as did the claims rate, but only from 1.8% to 2.0%. In other words, there's nothing to worry about. More sales mean more repairs, and more reserves.
On the other hand, Bucyrus International saw sales of its surface mining equipment soar 118% from $738 million to more than $1.6 billion, but at the same time warranty reserves grew more than twelve-fold. It had to do it -- claims jumped more than five-fold, and the claims rate more than doubled. Evidently, though the company is selling more product, it's also breaking more frequently, or at least the repairs are costing the company more per unit.
Expanding Through Acquisition
MPC Corp. is the new owner of Gateway's Professional Division, and as Figure 1 shows, its warranty reserves have expanded by 887% since the days before that acquisition when it was known as HyperSpace Communications Inc. SunPower Corp. is another new member of the big leagues, having acquired a solar power equipment company in early 2007 and accounting for it through a $7 million boost in its warranty reserve during the first quarter of that year. But all year, accruals have outpaced claims by more than 2:1, resulting in a constantly expanding reserve fund that's now almost 400% bigger than it was a year before.
Conversely, there were some 65 companies (30% of the sample) that actually reduced the size of their warranty reserves from the end of 2006 to the end of 2007. Again, the reasons varied from divestitures to changes in product mix to good old-fashioned reductions in warranty expenses. But some of the decreases listed in Figure 2 did not seem to have any basis in product or quality or company structure.
At NCR, for instance, the claims rate actually went up slightly, but the reserve shrunk from $21 million to $13 million in size. At Quantum, the claims rate jumped from 3.6% at the end of 2006 to 5.1% at the end of 2007, but the reserve was allowed to shrink from $33.5 million to $22.1 million in size. In both cases, the companies' capacity to pay claims also shrank, meaning that either their warranties suddenly got a lot shorter or the companies are modifying their calculation of what constitutes a reasonably-sized reserve.
Figure 2
Top U.S.-based Warranty Providers:
Largest Warranty Reserve Decreases,
2007 vs. 2006
(in $ millions and percent decline)
| Warranty | Vs. | |
| Reserve | Year | |
| Company | 12/31/07 | Before |
| Advanced Micro Devices | $15.0 | -42% |
| NCR Corp. | $13.0 | -38% |
| Tyco International Ltd. | $154 | -35% |
| Baker Hughes Inc. | $14.8 | -35% |
| Quantum Corp. | $22.1 | -34% |
| Owens Corning | $33.0 | -34% |
| Powerwave Technologies | $27.0 | -33% |
| IBM Corp. | $412 | -29% |
| Corning Inc. | $19.0 | -27% |
| Eastman Kodak Co. | $44.0 | -27% |
Theoretically, the warranty reserve's capacity to pay claims should be equal to the average length of the products it covers. Warranty accruals per unit sold should be equal to the amount of claims expected per unit in the future. And then the size of the warranty reserve should be large enough to pay all the claims for all the products already sold.
In practice, as some of the entries in Figure 2 suggest, the warranty reserve balance is subject to increases and decreases that have little to do with future expectations. Some are underfunding their warranty reserve, while others are using it as a "rainy day fund" that can be tapped when cash is needed. And while taking money out might raise suspicions, reducing the accrual rate below the claims rate has the same effect: decreasing balances.
Five-Year Trends
Since most companies have been reporting their warranty expenses for five years, we thought it would be interesting to see how warranty reserve balances have changed since the end of 2003. And it turns out that five of the top annual changes also show up on the list of top five-year gainers. Garmin, Bucyrus, Cypress Semiconductor, CalAmp, and Microsoft made both lists.
Figure 3
Top U.S.-based Warranty Providers:
Largest Warranty Reserve Increases,
2007 vs. 2003
(in $ millions and percent gain)
| Warranty | Vs. | |
| Reserve | Five Years | |
| Company | 12/31/07 | Ago |
| Sirona Dental Systems | $13.5 | +7208% |
| Microsoft Corp. | $861 | +5455% |
| CalAmp Corp. | $13.8 | +2472% |
| Bucyrus International | $70.9 | +1545% |
| Mohawk Industries Inc. | $46.2 | +790% |
| Stanley Works | $63.8 | +774% |
| Cypress Semiconductor | $20.3 | +757% |
| Garmin Ltd. | $71.6 | +753% |
| Powerwave Technologies | $27.0 | +459% |
| Ply Gem Holdings Inc. | $49.9 | +425% |
Conversely, Tyco International, Corning, IBM, Quantum, and Advanced Micro Devices made the lists in both Figures 2 and 4. At least two of those are divestiture stories, where a significant portion of the product line was sold or spun off into separate companies. Usually, part of the warranty reserve goes with those divisions. For if a company had truly set aside at the time of sale an amount equal to expected future claims, it would usually pass both the responsibility to pay those claims and the funds to do so to the new owners.
However, some of the companies that cut their warranty reserve fund balance in the past year have vastly increased it over the past five years. For instance, Powerwave Technologies ended 2007 with $27 million in its reserve fund. At the end of 2006 it had $40.3 million in the fund. But five years ago, it had only $4.8 million in the fund. The balance doubled in 2004 and doubled again in 2005. Sales have soared, but claims have also risen. At the end of 2003 about 1.4% of the company's wireless telecom equipment revenue was used to pay claims. Now that claims rate is up to 2.8%, and Powerwave has the peculiar distinction of making it onto the top ten lists of both Figure 2 and 3.
Long-Term Contractions in Reserves
Absent a massive corporate divestiture or spin-off, long-term contractions in the warranty reserve are relatively unusual. Only 36 large companies (17% of the sample) have seen the size of their warranty reserve shrink from the end of 2003 to the end of 2007. The top ten are listed in Figure 4. Other notables not in the top ten include Sun Microsystems, Brunswick Corp., Ingersoll-Rand, Eastman Kodak, and 3Com Corp.
Agilent Technologies is first on the list below, having seen its warranty reserve shrink from $71 million at the end of 2003 to $29 million in 2007. And while part of the reason is decreased product sales, most of the reason is reduced warranty spending. The company's claims rate was 1.5% in 2003, but it's 1.2% now. That means claims have fallen faster than sales, and less reserves are needed.
Figure 4
Top U.S.-based Warranty Providers:
Largest Warranty Reserve Decreases,
2007 vs. 2003
(in $ millions and percent decline)
| Warranty | Vs. | |
| Reserve | Five Years | |
| Company | 12/31/07 | Ago |
| Agilent Technologies | $29.0 | -59% |
| Tyco International Ltd. | $154 | -58% |
| Corning Inc. | $19.0 | -54% |
| IBM Corp. | $412 | -47% |
| Quantum Corp. | $22.1 | -47% |
| Mentor Corp. | $12.2 | -46% |
| Nortel Networks Corp. | $214 | -45% |
| Dell Inc. | $941 | -41% |
| Advanced Micro Devices | $15.0 | -39% |
| Midas Inc. | $24.8 | -36% |
Quickly, let's go through some of the industries that maintain warranty reserves, and list the changes over the past five years. In Figure 5, we've detailed the three transportation-related sectors, while in Figure 6 we've listed all the high-tech industries, and in Figure 7 we've included the four construction and home furnishing sectors.
Rainy Day Fund
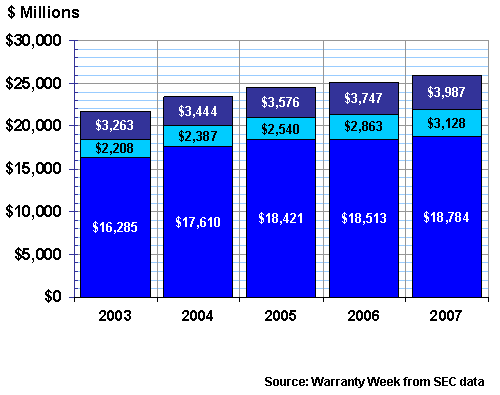
In all of these charts, the color code is the same as has been used for the past five newsletters. A quick glance suggests that as is also the case with both warranty claims and accruals, the automotive OEMs are the source of a significant portion of the warranty reserves as well. In fact, as we'll see in Figure 8, the automotive OEMs have a slightly higher share of the reserves than they do of either the claims or accruals. Over the years it's ranged from 45.5% to 47.8%, while in terms of claims it's always been close to 40%, meaning, perhaps, that the automakers are keeping a little extra in their reserves.
Figure 5
U.S. Transportation Manufacturers
Warranty Reserves, 2003 to 2007
(Year-end Balance in $ Millions)


Also over-represented in Figures 5 and 8 are the aerospace companies. While they account for 5% or 6% of claims paid, their $3 to $4 billion accounts for 9% or 10% of total reserves held. The auto parts manufacturers, meanwhile, are about equally represented on both the claims and reserves charts.
Perhaps because of the huge $18.8 billion total, the $270 million year-to-year expansion in the auto OEMs' collective warranty reserves registers as only a 1.5% increase. Auto parts makers also increased their warranty reserves, by some 9.3% in the most recent year. And the aerospace companies increased their year-end 2007 balances by 6.4%. Compared to five years ago, the increases for these three transportation sectors are 15%, 42%, and 22%, respectively.
High-Tech Warranty Reserves
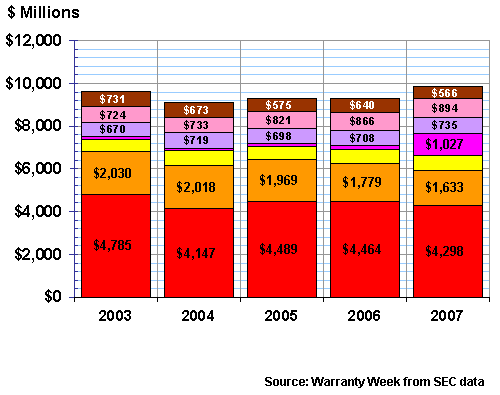
In the high-tech industries, two big changes have taken place. First, as can be seen in Figure 6, the consumer electronics category has quite recently jumped out of obscurity to more than a billion dollars in reserves. The sector has seen reserves expand by 810% since 2003, and has grown 586% since 2006. That is almost totally due to the Xbox 360.
Remember, these charts measure just U.S.-based manufacturers, and the sad truth is that outside of some speakers, digital music players and car audio gear, very little consumer electronics is manufactured by U.S.-based companies. Were it not for Microsoft, consumer electronics product warranties would be almost exclusively an issue for importers and retailers.
Figure 6
U.S. High-Tech Manufacturers
Warranty Reserves, 2003 to 2007
(Year-end Balance in $ Millions)


The second major trend in high-tech warranty reserves can be seen in the red band that marks the computer manufacturers. First, the reserves of major product lines such as the ThinkPad and Gateway's consumer laptops have taken on foreign ownership, so their reserves have been removed from the total. Second, Dell went through an accounting restatement last year (see Warranty Week, Nov. 7, 2007), which resulted in a clean split between basic and extended warranty reserves (the latter is usually called deferred revenue) that resulted in the removal and reclassification of almost a billion dollars in its warranty reserve.
The drop in 2004 is primarily Dell's. The drop in 2007 is primarily Gateway's and IBM's. Everything else has been more or less steady for five years.
Warranty Reserves in the Housing Industry
In Figure 7, the dark green band that represents homebuilders is the one showing the most expansion and contraction over the years. It expanded in size every year from 2003 to 2006, and then contracted by 5.8% from its peak by the end of 2007. The only categories to contract by more in the 2006-2007 period were telecom equipment (-8%) and computer peripherals (-12%).
The housing recession is also making its mark on the HVAC and appliance sector, however. There hasn't been as much expansion over the years, but in 2006-2007 there was also a 5.8% contraction in this sector's warranty reserves. Meanwhile, the big increase seen in Figure 7 came from the makers of power equipment, who expanded their reserves by 34% last year. And there was also a 10% expansion of the warranty reserves maintained by makers of building materials, fixtures, furniture, and other construction materials.
Figure 7
U.S. Building Manufacturers
Warranty Reserves, 2003 to 2007
(Year-end Balance in $ Millions)


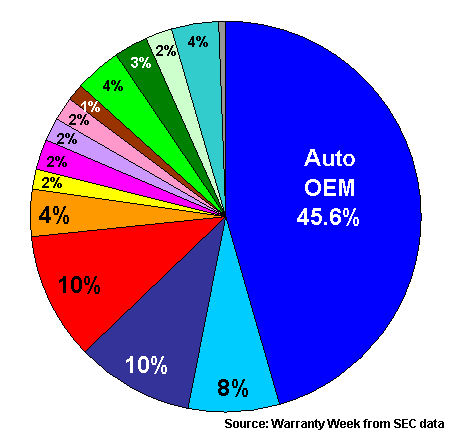
Figure 8 below takes all of the data presented in Figures 5, 6 and 7 and turns it into a pie chart. Notice that as with claims data, the largest pool of warranty reserves are in the computer and auto industries. Click on the chart below and you'll be taken to a new Web page containing similar pie charts for the years 2003 through 2006, as well as a chart that shows the quarterly fluctuations since 2003.
Figure 8
All U.S.-based Manufacturers
Warranty Reserves by Industry, 2007
(Percent of $41.1 Billion)

As mentioned, the auto OEM sector has a somewhat greater share of reserves than claims, as do the aerospace companies. Computers have precisely the opposite: more claims than reserves. Everything else is within a percentage point or two of parity. The corresponding series of claims pie charts, by the way, is on a Web page located at http://www.warrantyweek.com/library/ww20080410/ww20080410-pie.html.
Readers are encouraged to save a copy of any of these slides and insert them into your own presentations. We kept the color code the same from week to week precisely for this reason, so that one week's set of charts would fit beside another taken from a different week.
This is all public data, available to anyone with the time and the patience to slog through some 18,000 quarterly and annual reports looking for warranty expense disclosures. And now, with the final posting of this series of newsletters on five-year warranty trends, so is the summary data.
Go to Part One
Go to Part Two
Go to Part Three
Go to Part Four
Go to Part Five
This is Part Six


