Warranty in the IT Industry:
Readers ask for more details on warranty claims and accruals in the computer, telecom, semiconductor, disk drive, and peripherals industry sectors.
The examination of trends in warranty claims and accruals among U.S. manufacturers was scheduled to conclude two weeks ago with a look at companies not following Generally Accepted Accounting Principles in their quarterly and annual financial statements. But then two things happened over the holidays. First, Nortel Networks Corp. filed revised Form 10-Q statements for the first and second quarters of 2003 with the U.S. Securities and Exchange Commission on Dec. 23, which had the effect of shifting $18 million in warranty claims from the third quarter to earlier periods. Second, numerous Warranty Week subscribers requested more detail on warranty claims and accruals in the information technology, as was offered in the Dec. 15 issue.
After automotive, the information technology industry is the largest source of warranty claims and accruals, accounting for just over a third of the reported volume in the first three quarters of 2003. Because of Nortel's revisions, even the selected IT industry charts in the Dec. 15 issue needed to be revised. And so, rather than making that new data available just to those who requested it, we decided to make it available to all. What follows, then, is an unscheduled Part Five of the quarterly roundup of U.S. manufacturers' warranty claims and accruals, spotlighting five different sectors of the IT industry: computers, telecom & network equipment, semiconductor & printed circuits, data storage, and peripherals.
First, let's take a look at what Nortel did. In August, the company filed its second quarter 10-Q, which included a first-time report of warranty claims and accruals. The Canadian company reported $45 million in claims and $51 million in accruals for the first six months of 2003. Along with a $9 million change of estimate, these figures changed the company's warranty reserve balance from $240 million at the beginning of the year to $237 million at the end of the year.
Nortel's Old Second Quarter Form 10-Q
(filed Aug. 12, 2003)
Balance as at December 31, 2002 |
$ | 240 | |||
Payments |
(45 | ) | |||
Warranties issued |
51 | ||||
Other changes |
(9 | ) | |||
Balance as at June 30, 2003 |
$ | 237 | |||
Nortel also noted that many of its accrual balances were under review for possible revision. Those revisions came on Dec. 23, when amended Form 10-Q statements were filed with the SEC. In this new warranty table, the beginning balance was $255 million and the ending balance was $255 million. Claims increased by $18 million and accruals increased by $13 million.
Nortel representatives were contacted and were asked to help explain the revisions, as well as to reconcile the different beginning and ending balances for their warranty reserve fund. One gets the feeling when contacting large companies about their warranty footnotes and tables that they've never been asked about them before. Such was the case in this instance as well. Nortel was unable to make a statement before this issue of Warranty Week went out to subscribers.
For now, all we have to offer are the following passages included in the Form 10-Q that Nortel filed for the third quarter:
2. Restatements
In 2001, Nortel Networks entered into an unprecedented period of business realignment in response to a significant adjustment in the telecommunications industry. Industry demand for networking equipment dramatically declined in response to the industry adjustment, severe economic downturns in various regions around the world and a tightening in global capital markets...
Nortel Networks initiated, and disclosed in its Quarterly Report on Form 10-Q for the period ended June 30, 2003, a comprehensive review and analysis of its assets and liabilities. On October 23, 2003, Nortel Networks announced it would restate its consolidated financial statements for the years ended December 31, 2000, 2001 and 2002 and for the quarters ended March 31, 2003 and June 30, 2003.
Based on the completion of the comprehensive review and certain related reviews ... Nortel Networks has determined that approximately $952 [million] of certain liabilities (primarily accruals and provisions) carried on its previously reported consolidated balance sheet as at June 30, 2003 needed to be released to income in prior periods as part of the restatements. These provisions were either initially recorded incorrectly in prior periods or not properly released or adjusted for changes in estimates in the appropriate periods. In certain cases, costs were incorrectly charged to operations rather than to the appropriate provisions...
Other accruals and provisions
Nortel Networks determined that approximately $185 [million] of accruals and provisions related to certain items should not have been recorded as the appropriate conditions and documentation supporting the establishment of these accruals and provisions did not exist at the time of such recognition. The restatement adjustments included the reversal of these accruals and provisions in the periods in which they were originally recorded.
These restatement adjustments included $51 [million] release of provisions previously established to bring into balance certain inter-company payables and receivables, $35 [million] reversal of accruals for costs associated with programs to upgrade certain financial information systems and $25 [million] reversal of accruals for discretionary bonuses in excess of amounts reasonably expected to be paid. Other adjustments made in connection with the restatements totaled $74 [million] which related to the need to make modifications to accruals in a number of specific areas of risk in Nortel Networks businesses, including adjustments to accounts payable balances, warranty provisions, and other provisions and accruals.
If a reply to specific warranty-related questions arrives later, it will be included here in the online edition of this column. In addition, readers of the Plain Text Edition or those whose email systems remove graphics from incoming messages are also requested to view the online edition to see the graphics included below. At this point, third quarter financial reports have been filed by all but a handful of manufacturers, so the numbers quoted below are more or less final.
Nortel's New Second Quarter Form 10-Q
(filed Dec. 23, 2003)
Balance as at December 31, 2002 |
$ | 255 | |||
Payments |
(63 | ) | |||
Warranties issued |
64 | ||||
Adjustments |
(8 | ) | |||
Balance as at June 30, 2003 |
$ | 248 | |||
Meanwhile, Nortel had filed its third quarter 10-Q statement on time in November. In that document, warranty claims were combined with "known product defects," and so an entirely new beginning balance was used for Dec. 31, 2002. Instead of $240 or $255 million, the beginning balance was $361 million. Claims for the nine months stood at $127 million, and accruals for new warranties stood at $167 million. The change of estimate, meanwhile, had grown from $8 or $9 million to $72 million.
We don't want to make too much of this increase except to note that the $72 million downward revision in the table below goes right to the income statement, lowering the cost of sales and boosting gross profit. Given that Nortel's operating earnings (before taxes) were $124 million for the third quarter, it is no exaggeration to say that more than half that amount came from the warranty reserve. This is how important warranty management can be. It can literally double your net income in a tight quarter.
However, there's still the question of quarterly claims and accruals. Third quarter figures can be derived by subtracting six-month numbers from nine-month numbers. First and second quarter figures can be estimated by dividing six-month figures in half. But which numbers should be used? If Nortel has recently broadened the definition of its warranty reserve to include "known product defects," are those numbers any longer comparable to the six-month figures?
Nortel's Third Quarter Form 10-Q
(filed Nov. 19, 2003)
Balance as at December 31, 2002 |
$ | 361 | |||
Payments |
(127 | ) | |||
Warranties issued |
167 | ||||
Revisions |
(72 | ) | |||
Balance as at September 30, 2003 |
$ | 329 | |||
For now, we're going to estimate Nortel's third quarter warranty claims at $64 million, and estimate first and second quarter claims at $32 million each. That's a big change from the $82, $22.5, and $22.5 million figures used in the Dec. 15 issue. Indeed, before today's issue was sent out, the charts in the online edition of the Dec. 15 issue also were revised in classic Orwellian fashion. Two of the charts are repeated below, along with three previously unpublished graphics and Top Ten lists for each sector.
Warranty in the IT Manufacturing Industry
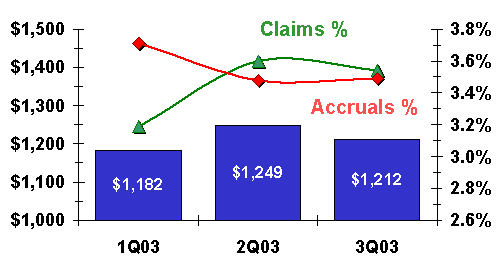
In the U.S. automotive industry, there are the Big Three, the import nameplates, the heavy truck manufacturers, and a large number of parts and component suppliers of each. In the computer sector of the IT industry, the Big Three in terms of warranty providers are Hewlett-Packard, IBM, and Dell. Out of a total of $1.2 billion in third quarter warranty claims reported by all computer manufacturers, more than 87% were reported by these three companies. So the 3.5% claims and accrual rates you see in the chart below are more or less the mathematical average of these three companies' individual rates, with Sun, Gateway, Apple and others making a small additional impact. There are only 12 companies in this first-of-five sector, yet together they account for 60% of all warranty in the whole IT industry.
Warranty Claims in Computers
Nine Months, 2003
Source: Warranty Week
In the charts depicting these five IT industry sectors, there is no crossover between sectors. In other words, although a Big Three company such as Hewlett-Packard or Dell might fit into any of several sectors, they are counted only once in the sector in which they seem to fit best. Therefore, since there is no overlap, one could add the totals for the five sectors and find that warranty claims in the IT industry as a whole topped $2 billion in the third quarter, up a slight 0.3% from the second quarter.
Each of the Top Ten lists below were prepared by first selecting the ten largest warranty claims within each sector in dollar terms, and then ranking them from highest to lowest claims rate. The claims rates and accrual rates are based on either a company's reported product revenue figures, or when not available, upon a Warranty Week estimate derived from total revenue minus 10% to 20% we assumed was derived from service, finance, consumables, and other non-warranted revenue streams.
There is no "normal" for warranty claims and accrual rates, and the rates of different companies are not directly comparable. Not only do they each have different product mixes, different classes of customers (carriers, consumers, end user businesses, etc.), and varying warranty durations, but they also each have different accounting standards and assumptions built into their warranty disclosures. In any event, the total claims rate and accrual rate in the Top Ten list for each sector should agree with the ending rates for the green and red lines in each graphic. And as can be seen from these charts, most IT manufacturers are within a range of 1% to 5% for both warranty claims and accruals rates.
The capacity of the warranty reserve fund is measured by the division of the most recent figure for monthly warranty claims by the reserve fund balance as of Sept. 30. It is a momentary measure of capacity, expressed as the number of months a given reserve would last if accruals ceased now. Most manufacturers are in the 10-to-20-month range, which means their chief financial officers are comfortable with a reserve balance that is ten to twenty times their monthly claims totals.
Top Ten Computer Warranty Providers
Third Quarter, 2003
| Claims as | Accruals as | Warranty- | |
| Percent of | Percent of | Months in | |
| Company | Product Sales | Product Sales | Reserves |
| Gateway Inc. | 5.7% | 4.2% | 3.2 |
| Sun Microsystems Inc. | 5.4% | 5.0% | 8.7 |
| Palm Inc. | 4.9% | 3.9% | 5.9 |
| Hewlett-Packard Co. | 4.2% | 3.8% | 10 |
| IBM Corp. | 3.3% | 3.3% | 8.4 |
| Cray Inc. | 3.0% | na | 5.5 |
| Dell Inc. | 2.7% | 3.7% | 19 |
| Silicon Graphics Inc. | 2.3% | 2.2% | 6.7 |
| Apple Computer Inc. | 1.3% | 1.2% | 11 |
| Unisys Corp. | 0.4% | 0.5% | 13 |
| Others (2) | 0.7% | 1.1% | 20 |
| Total | 3.5% | 3.5% | 11 |
Source: Warranty Week
The accrual rate is an expression of the percentage of new product revenue that is set aside to fund new warranties. In other words, an accrual rate of 3% means that $3.00 out of each $100 in product revenue is set aside to fund predicted future warranty claims associated with those products. The claims rate, meanwhile, is a measure of actual claims settled in the current quarter (arising from products sold in earlier periods) compared to current sales. It is a measure of how accurate management's past predictions turned out to be, although rapidly rising or falling revenue totals also have an effect.
Slight imbalances between the two percentages probably mean the company is constantly adjusting its predictions to match the actuals. Large imbalances probably mean the company has chosen to either expand or contract its warranty reserve fund, although most companies pursue this course through separate changes of estimate. For instance, IBM has chosen to add $58 million to its reserve fund above and beyond past accruals. Seagate has added $19 million. Lucent has removed $17 million, and Lexmark has removed $32 million. These changes of estimate have the effect of increasing or decreasing the net accrual rate, hopefully moving it closer to the claims rate.
Warranty in the Telecom & Data Communications Sector
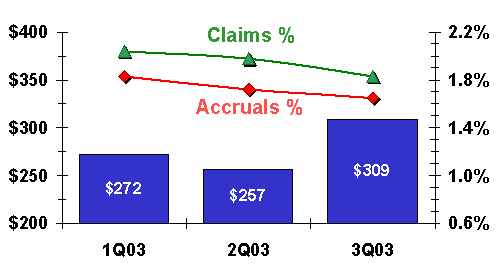
The chart below includes more than 100 manufacturers of the equipment and systems used to operate telephone, cable TV, Internet, wireless phone, and broadcasting networks. It also includes some of the products sold to consumers and businesses that are customers of these network operators. In other words, it includes both central office switches and telephone handsets. It includes both cable TV head ends and set-top boxes. It includes both cellular telephone base stations and handsets. But while it includes radio and television broadcasting equipment, it does not include the TVs or radios themselves. Those are counted separately as consumer electronics items.
Most of the data communications manufacturers are included here as well. Whether it be a modem, a router, a multiplexer, or an Ethernet card, any networking gear designed to connect a computer to a network is included here. Also included are fax machines and fax/printer/copier combinations, although printers are counted as peripherals further down and copiers are counted separately as office equipment and furniture. Fortunately, the only large American manufacturers affected by this somewhat arbitrary division are Xerox, HP, and Lexmark. Most other manufacturers of fax, printer, or copier equipment are based internationally, and are therefore not reporting their warranty activity to the U.S. SEC.
Warranty Claims in Telecom & Data Network Equipment
Nine Months, 2003
Source: Warranty Week
As can be seen in the above chart, claims grew by more than 20% from the second to third quarter, despite the revisions of Nortel and despite industry-wide claims and accrual rates that recently have been trending slightly downwards. Besides Nortel, Cisco and Lucent also saw claims increase, albeit by much smaller percentages of 8.3% and 8.2%, respectively. The only increases that could be described as "surges" were reported by Nortel and Ciena. Still, the sector as a whole grew by 20%. Go figure.
Top Ten Telecom Warranty Providers
Third Quarter, 2003
| Claims as | Accruals as | Warranty- | |
| Percent of | Percent of | Months in | |
| Company | Product Sales | Product Sales | Reserves |
| Ciena Corp. | 7.2% | 3.9% | 17 |
| 3Com Corp. | 5.2% | 5.5% | 16 |
| Juniper Networks Inc. | 5.1% | 5.2% | 12 |
| JDS Uniphase Corp. | 3.5% | 0% | 24 |
| Lucent Technologies Inc. | 3.4% | 2.0% | 19 |
| Avaya Inc. | 2.4% | 2.3% | 6.7 |
| Nortel Networks Corp. | 2.3% | 3.0% | 15 |
| Cisco Systems Inc. | 1.8% | 1.8% | 9.4 |
| UTStarcom Inc. | 1.1% | 2.0% | 9.8 |
| Scientific-Atlanta Inc. | 1.1% | 1.1% | 24 |
| Others (99) | 0.8% | 0.8% | 21 |
| Total | 1.8% | 1.7% | 15 |
Source: Warranty Week
Telecom/datacomm sector manufacturers are extremely close to the averages registered by all U.S. manufacturers. For instance, telecom claims are at 1.83% and accruals are at 1.65%. All manufacturing claims are at 1.78% and all manufacturing accruals are at 1.75%. Meanwhile, telecom sector warranty reserve capacity stands at 15.2 months, very close to the median for all manufacturers.
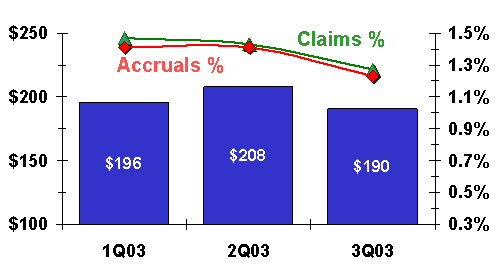
Warranty Claims in Semiconductors & Printed Circuits
Nine Months, 2003
Source: Warranty Week
Semiconductor and printed circuit board makers are the parts suppliers of the information technology industry. Among the semiconductor and PC board manufacturers, both warranty claims and accruals have lately taken a downturn. However, there always has been a wide gap between the claims and accrual rates reported by the semiconductor manufacturing equipment makers (high) and the makers of the semiconductors themselves (low). This gap can be seen in the table below, where equipment suppliers such as Novellus and Applied Materials are experiencing claims and accruals at a much higher rate than chipmakers such as AMD.
It should be noted that Intel Corp. and several other major chipmakers have declined to follow GAAP, stating that their warranty claims and accruals are "insignificant" or "not material." However, 87 manufacturers in this sector have followed FASB FIN 45 rules rather precisely, from the tens of millions of dollars reported by Novellus and Applied Materials all the way down to broadband and wireless chipmaker Endwave Corp., which reported exactly $2,000 in claims during the third quarter.
Top Ten Semiconductor & Printed Circuit Warranty Providers
Third Quarter, 2003
| Claims as | Accruals as | Warranty- | |
| Percent of | Percent of | Months in | |
| Company | Product Sales | Product Sales | Reserves |
| Axcelis Technologies Inc. | 7.8% | 7.0% | 11 |
| Cymer Inc. | 6.9% | 5.0% | 15 |
| Novellus Systems Inc. | 5.4% | 5.3% | 8.1 |
| Advanced Energy Industries | 5.0% | 3.7% | 5.4 |
| KLA-Tencor Corp. | 3.2% | 3.1% | 11 |
| Applied Materials Inc. | 2.8% | 2.5% | 14 |
| Lam Research Corp. | 2.6% | 1.3% | 8.5 |
| Agilent Technologies Inc. | 1.5% | 1.3% | 11 |
| Honeywell International | 0.9% | 1.0% | 13 |
| Advanced Micro Devices | 0.9% | 1.2% | 12 |
| Others (77) | 1.0% | 0.9% | 15 |
| Total | 1.3% | 1.2% | 13 |
Source: Warranty Week
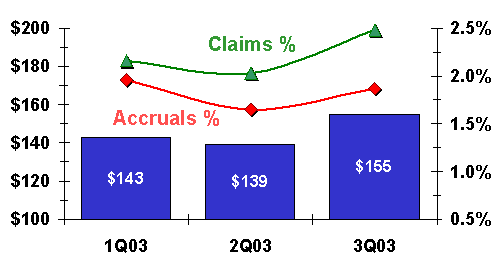
Within the disk drive and data storage industry, claims and accruals have lately trended upwards. In addition, claims have outpaced accruals in each of the three quarters reported so far. Though the gap isn't huge, it's enough to cause warranty reserves in this industry sector to shrink somewhat. Aggregate warranty reserves in this sector were $707 million as of March 31 and $693 million as of June 30, but had contracted to $660 million by Sept. 30.
Warranty Claims in Data Storage Systems
Nine Months, 2003
Source: Warranty Week
The "Big Three" of data storage warranty are Maxtor, EMC, and Seagate. These three reported nearly 73% of all warranty claims in this sector. As can be seen in the table below, EMC's claims and accrual rates are very close to each other while Maxtor's and Seagate's reflect some of the divergence seen in the industry as a whole. Seagate, however, made up for the accrual shortfall with the aforementioned $19 million change of estimate infusion. Its warranty reserve shrank only slightly, while Maxtor's contracted by $15 million. Hutchinson Technology Inc. and Computer Network Technology Corp. each expanded their reserves by more than 50%, while StorageTek expanded its reserves by a more modest 8.4%.
Top Ten Data Storage System Warranty Providers
Third Quarter, 2003
| Claims as | Accruals as | Warranty- | |
| Percent of | Percent of | Months in | |
| Company | Product Sales | Product Sales | Reserves |
| Quantum Corp. | 6.5% | 3.7% | 14 |
| Maxtor Corp. | 4.6% | 3.2% | 15 |
| Storage Technology Corp. | 3.9% | 3.7% | 11 |
| Seagate Technology | 2.5% | 1.2% | 8.9 |
| Iomega Corp. | 2.0% | 1.3% | 9.4 |
| EMC Corp. | 1.6% | 1.5% | 19 |
| Western Digital Corp. | 1.6% | 1.9% | 14 |
| Computer Network Tech. | 1.5% | 1.0% | 6.0 |
| Hutchinson Technology | 1.4% | 1.5% | 2.1 |
| Adaptec Inc. | 1.0% | 0.9% | 3.5 |
| Others (13) | 0.7% | 0.7% | 15 |
| Total | 2.5% | 1.9% | 13 |
Source: Warranty Week
Last but not least is the computer peripherals sector. Into this category are placed all the manufacturers of printers, monitors, and scanners, along with manufacturers of components such as laptop/handheld batteries, surge protectors, and power supplies. As such, it is less a grouping of alike companies and more of a list of manufacturers who don't fit in as computer, telecom, semiconductor, or disk drive suppliers.
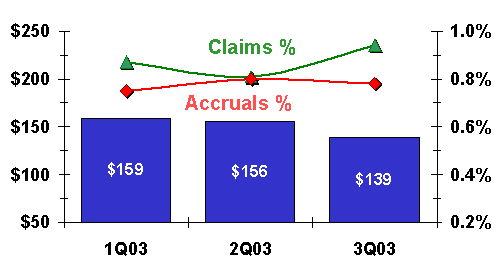
As can be seen in the chart below, claims and accruals were in approximate balance during the second quarter, but were far apart in both the first and third quarters. However, both rates are notably lower than they are in other sectors, and the quarter-to-quarter rate changes have not been that large. Meanwhile, in dollar terms claims were down by just over 1% from the first to second quarter, and were down by 11% from the second to third quarter.
Warranty Claims in Computer Peripherals
Nine Months, 2003
Source: Warranty Week
The "Big Three" in this sector are Lexmark, Xerox, and Tyco. Interestingly, both Lexmark and Tyco report quarterly claims amounts in the range of $40 to $45 million, but because of differing totals for product revenue their claims rates are radically different. We should note that Lexmark's printer supplies and consumables revenue is not part of these calculations, nor are Tyco's alarm monitoring services.
Top Ten Computer Peripheral Warranty Providers
Third Quarter, 2003
| Claims as | Accruals as | Warranty- | |
| Percent of | Percent of | Months in | |
| Company | Product Sales | Product Sales | Reserves |
| Lexmark International | 8.3% | 11% | 12 |
| InFocus Corp. | 3.8% | 3.5% | 8.2 |
| C&D Technologies Inc. | 2.8% | 1.4% | 12 |
| Exide Technologies | 2.3% | 2.0% | 17 |
| NCR Corp. | 1.5% | 1.5% | 5.3 |
| Diebold Inc. | 1.5% | 1.7% | 8.1 |
| Xerox Corp. | 0.8% | 0.8% | 5.8 |
| Harman International | 0.6% | 1.5% | 21 |
| Tyco International Ltd. | 0.6% | 0.1% | 31 |
| Dover Corp. | 0.5% | 0.5% | 19 |
| Others (35) | 0.5% | 0.5% | 18 |
| Total | 0.9% | 0.8% | 17 |
Source: Warranty Week
All together, some 291 manufacturers either partially or wholly within the IT industry reported $2.005 billion in warranty claims during the third quarter, a marginal increase from the $1.998 billion reported in the second quarter and the $1.937 billion reported in the first quarter. The total for the IT sector for the year to date is $5.94 billion, which is roughly 35% of all U.S. manufacturing product warranty claims.
| Back to Part Four |
Warranty Becomes a Board-level IssueJanuary 5, 2004 Extended Warranties in the UK: After concluding that British retailers charge some of the highest prices in the world for extended warranties, the UK's Competition Commission's final report advocates reforms of the salesperson-to-consumer relationship.January 20, 2004


